
Somebody asks the question in a planning meeting, and within about ninety seconds it has become a multiplication problem.
We sell into four verticals. There are three people in the buying committee who each need a different argument. Deals split into two sizes and the small ones need a shorter story. Four times three times two. Twenty-four decks.
Nobody says twenty-four out loud, because twenty-four is obviously absurd. So the number gets negotiated down to something that sounds sane — six, maybe eight — and six decks get built, and for about a quarter it feels like an achievement. Then pricing changes. Then two of the four customer logos on the proof slide are no longer customers. Then the product ships a redesign and every screenshot in every deck is wrong.
At that point something predictable happens: two of the six decks get updated, because those are the two the team actually uses, and the other four do not. They stay in the drive. They keep their old file names. And roughly seven months later a rep who joined in the meantime finds one, likes it better, and presents last year's pricing to a live prospect.
This is the failure that the question is really about, and it is invisible in every article that answers it. Search for how many decks a sales team needs and you get answers about how many slides — ten, twelve, the 10/20/30 rule, twelve plus an appendix. Search harder and you find the version conversation, but it is entirely founder-and-investor shaped: you need two pitch decks, one to present on stage and one to email, which is true and is about fundraising, not about a sales team of ten people selling the same product to four different industries every week.
Between those two literatures sits the calculation that actually decides the number. Not how many decks you would like. How many decks you can keep true.
Because a deck is not an artefact you produce. It is a subscription you take out. Every deck you create commits you to a stream of small obligations — this quarter's pricing, this quarter's logos, this month's product screenshots — for as long as it exists and is reachable. Create more of those subscriptions than you can service and you have not expanded your enablement, you have distributed misinformation with your logo on it.
So this piece runs the other calculation. What actually distinguishes a version from a variant, and the single test that settles it. The three-layer architecture that lets a team serve nine different sales situations out of two decks. What one deck genuinely costs to keep alive in hours per year. The division problem that turns that cost into a ceiling. Why the second deck is far more expensive than the first unless you do one specific thing. And what to do about the decks your reps are already making without telling you.
Version or variant: the distinction that decides the whole cost structure
Everything downstream depends on getting two words apart, so it is worth being precise about them.
A version is a separate object with its own narrative. It has its own file, its own slide order, and — this is the part that costs money — its own copy of every slide. When pricing changes, someone has to open it and change it. When you lose the right to use a customer's logo, someone has to remember it exists. A version is a permanent, recurring liability on the maintenance budget.
A variant is the same deck with different slides dropped into fixed positions. The order does not change. The argument does not change. Slide 7 is always the proof slide; in the healthcare variant it holds three healthcare logos and in the logistics variant it holds three logistics logos. Everything that is not slide 7 is shared, and shared means that when pricing changes, it changes everywhere at once.
The difference between those two things is not tidiness. It is the entire cost structure of your enablement, and it is the reason two teams with identical-looking deck libraries can have a fourfold difference in what those libraries cost to run.
Almost every team that thinks it has a version problem has a variant problem that was solved with versions.
The fork test
Here is the test that settles individual cases, and it is deliberately hard to pass.
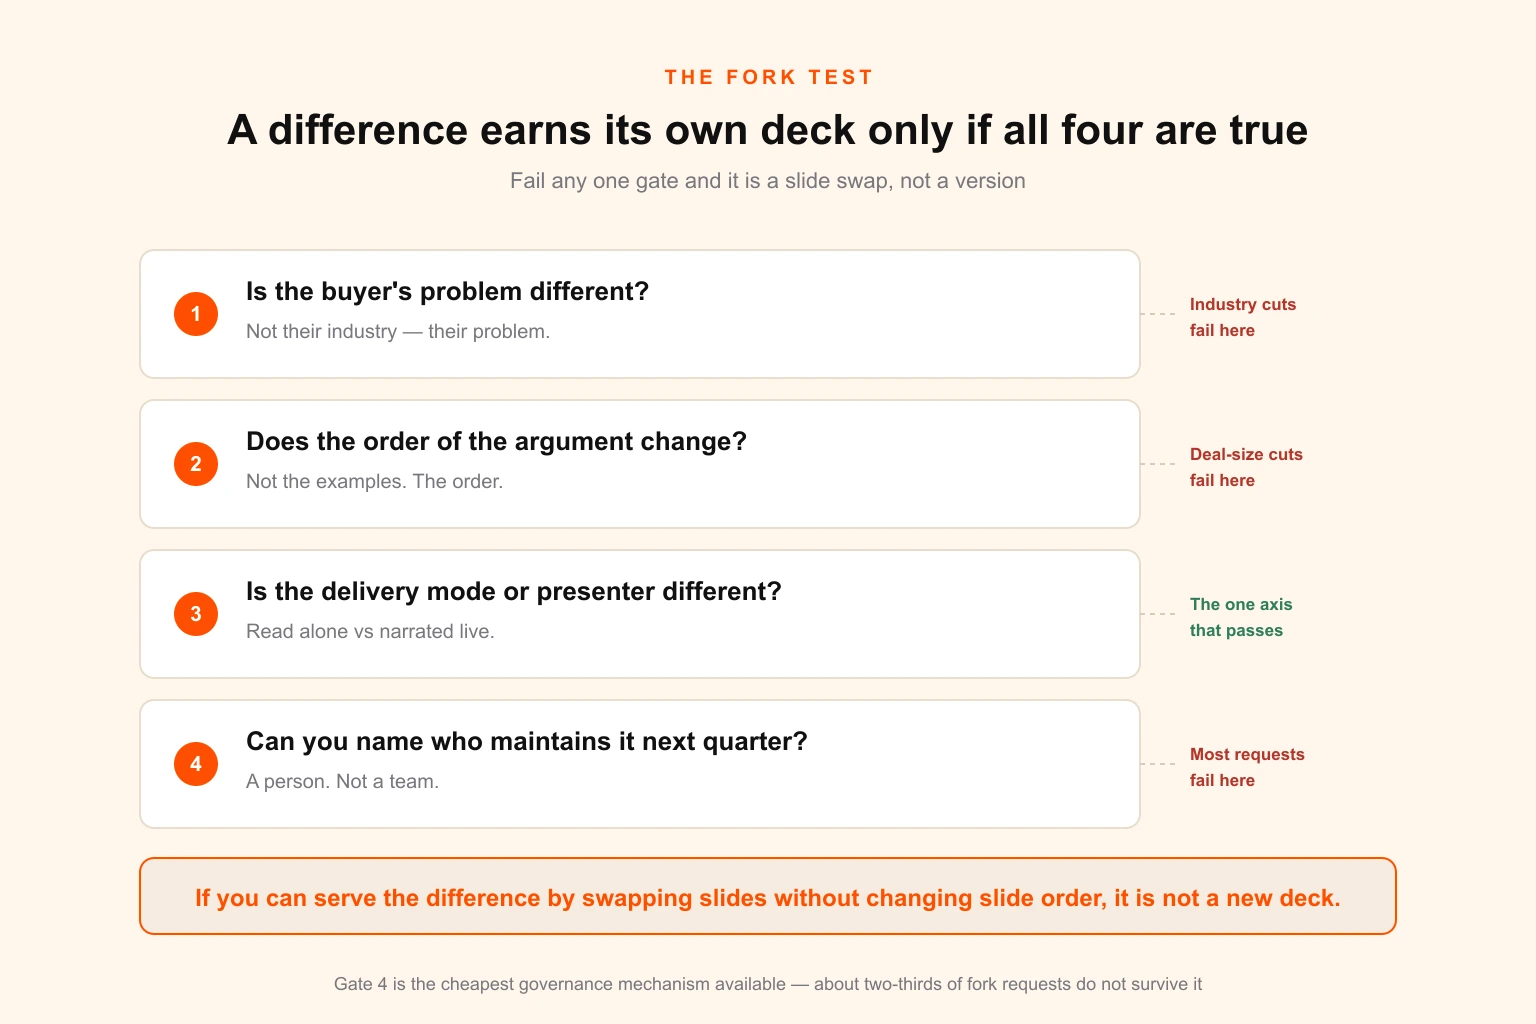
A difference earns its own deck only when all four of these are true:
- The buyer's underlying problem is different — not their industry, not their job title, their actual problem. A hospital procurement officer and a logistics procurement officer have the same problem. A procurement officer and a practitioner do not.
- The order of the argument changes. Not the examples in it. The order. If you would say the same six things in the same six positions and only swap which customer you name, that is a variant.
- The delivery mode or the presenter is different. A deck that will be read alone is genuinely a different object from a deck that will be narrated, and we will come back to why.
- You can name the individual who will maintain it next quarter. A name. Not a team.
Gate four is where most requests die, and it should. A fork with no owner is not a deck, it is a future embarrassment with a filename on it. Requiring a name at the moment of creation is the single cheapest governance mechanism available, because it converts an abstract wouldn't it be good if into a specific person agreeing to spend specific hours, and about two-thirds of fork requests do not survive that conversion.
The compressed form, worth putting on a wall: if you can serve the difference by swapping slides without changing slide order, it is not a new deck.
The industry cut is the one that most often fails the test while feeling most like it should pass. It feels obvious that a healthcare deck and a manufacturing deck should be different decks. But run the four gates honestly and the healthcare buyer's problem is usually the same problem your manufacturing buyer has, expressed in different vocabulary, with different regulatory furniture around it, and the argument you make runs in exactly the same order. What differs is the proof, the vocabulary and one compliance slide. Three swaps. Not a deck.
The three-layer architecture
If versions are expensive and variants are cheap, the design problem is to push as much of the difference as possible down into the variant layer. The structure that does this has three layers, and the number of objects at each layer is the answer to the original question.
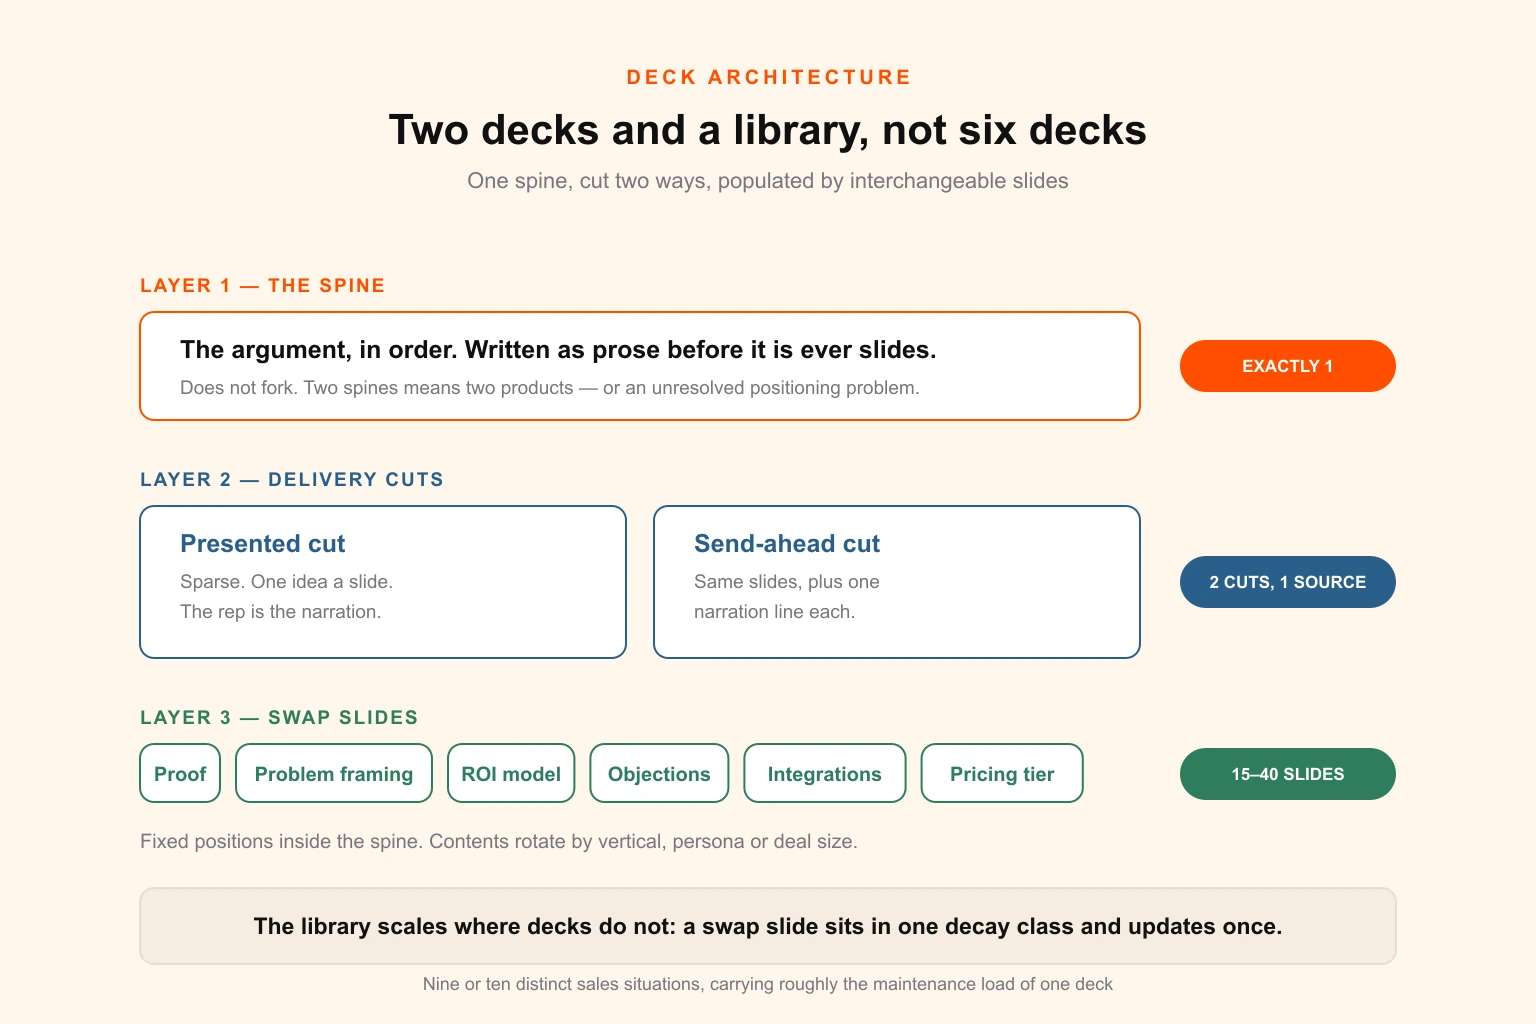
Layer 1 — The spine. Exactly one.
The spine is the argument. Not the slides — the sequence of claims that has to land, in order, for someone to buy.
Most good B2B spines are some variation of: something in the world has changed; that change creates winners and losers; here is what the losers look like; here is what winning looks like; here is evidence that we get people there; here is how to start. The specific formulation matters less than the fact that it is written down somewhere as prose before it is ever slides.
The spine does not fork. If you have two spines, you do not have two decks — you have two products, or two companies, or a positioning problem you have not resolved and are papering over with collateral. That is worth saying plainly, because "we need a different deck for X" is very often the visible symptom of an unresolved positioning argument, and building the deck buries the argument instead of settling it. If that is where you are, the work is upstream: brand positioning and brand strategy are the exercises that produce a single spine, and doing them badly is what produces a deck library that keeps growing.
One consequence worth stating: because the spine is the thing that never changes, it is also the thing worth spending real design effort on. Layer 1 is where visual craft compounds. It is the same logic that makes visual hierarchy worth getting right once on a master template rather than negotiating slide by slide.
Layer 2 — The delivery cuts. Two, occasionally three.
This is the only axis on which a genuine second deck object is justified, and it is justified for a reason that has nothing to do with your market.
The presented cut is sparse. One idea per slide, minimal text, large type, room to breathe. It works because a person is standing next to it doing the explaining. Its job is to hold attention and give the rep structure, not to contain the argument.
The send-ahead or leave-behind cut has no narrator. It gets forwarded to someone who was not in the room — increasingly, it gets forwarded to three or four such people, which is the entire reason it exists — and it has to carry its own argument or it fails silently. Nobody tells you that the deck you sent did not make sense without you.
Trying to serve both with one file produces the universal failure state: a deck too dense to present and too thin to read alone. Everyone has sat through one. The presenter reads paragraphs aloud from slides the audience is simultaneously reading faster than they can be spoken.
The important move here is that these two cuts do not need to be two designs. They need to be one design with a narration layer: one explanatory sentence per slide, present in the send version, suppressed in the live version. Depending on your tooling that is speaker notes promoted into a caption band, a hidden text layer toggled by a template switch, or simply an export preset. Either way both cuts share every slide, share every update, and stay on one maintenance schedule. You get two objects for something close to the cost of one.
A third cut is worth having only if you genuinely do stage work — conference sessions, webinars, a partner keynote. Stage slides are a different animal: they read from thirty feet, carry almost no text, and move about three times faster. If you do two events a year, borrow the presented cut and cut it down by hand. If you run a real event programme, this earns its place, and the wider question of what an event actually consumes is covered in the event production timeline and the trade show asset checklist.
How long each cut should be
Slide count is the question everyone actually asks, and it has a better answer than a rule of thumb: derive it from the meeting.
A slide that carries one idea and gets discussed rather than read takes 60 to 90 seconds. The deck does not get the whole meeting — a first call spends time on rapport, discovery and next steps, and a deck that eats all of it is a monologue. So the budget is airtime divided by pace.
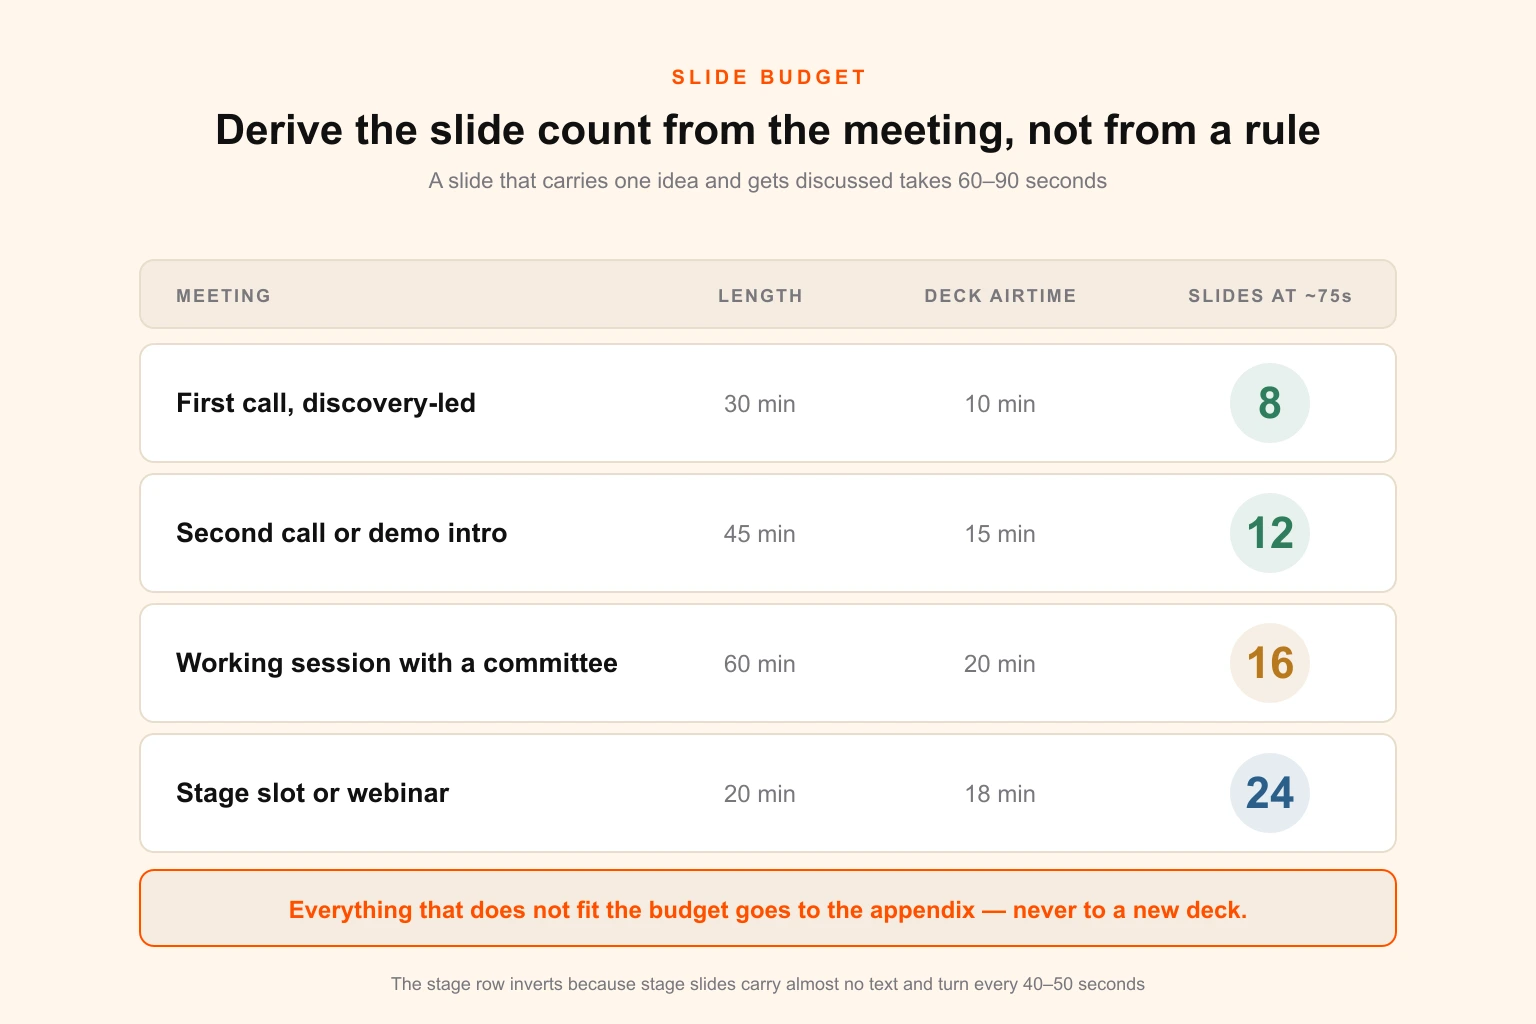
| Meeting | Length | Realistic deck airtime | Slides at ~75s |
|---|---|---|---|
| First call, discovery-led | 30 min | 10 min | 8 |
| Second call or demo intro | 45 min | 15 min | 12 |
| Working session with a committee | 60 min | 20 min | 16 |
| Stage slot or webinar | 20 min | 18 min | 24 (sparse, fast) |
The stage row inverts because stage slides carry almost no text and turn every 40 to 50 seconds. That is why a conference deck cannot simply be the sales deck with the logo changed, and why it is the one plausible candidate for a third cut.
The send-ahead cut runs slightly longer than its presented twin — typically two to four slides more — because the narration layer occasionally needs a slide of its own where a rep would have said something that will not fit in a caption.
Everything that does not fit the budget goes to the appendix. That sentence is doing a lot of work, and it is the mechanism that keeps deck count from growing, so it gets its own section further down.
Layer 3 — Swap slides. As many as you like.
Everything else lives here, and this is the layer that absorbs all the pressure that would otherwise turn into decks.
A swap slide occupies a fixed, named position inside the spine and comes in as many editions as you have situations. The positions are stable; the contents rotate:
- Proof position — customer logos, case metrics, quotes, by vertical or company size
- Problem framing position — the same problem in the buyer's own vocabulary
- ROI position — the value model in the units that persona is measured on
- Objection position — security, compliance, implementation, migration
- Integration position — the two or three systems that buyer actually runs
- Pricing position — tier or packaging relevant to the deal size
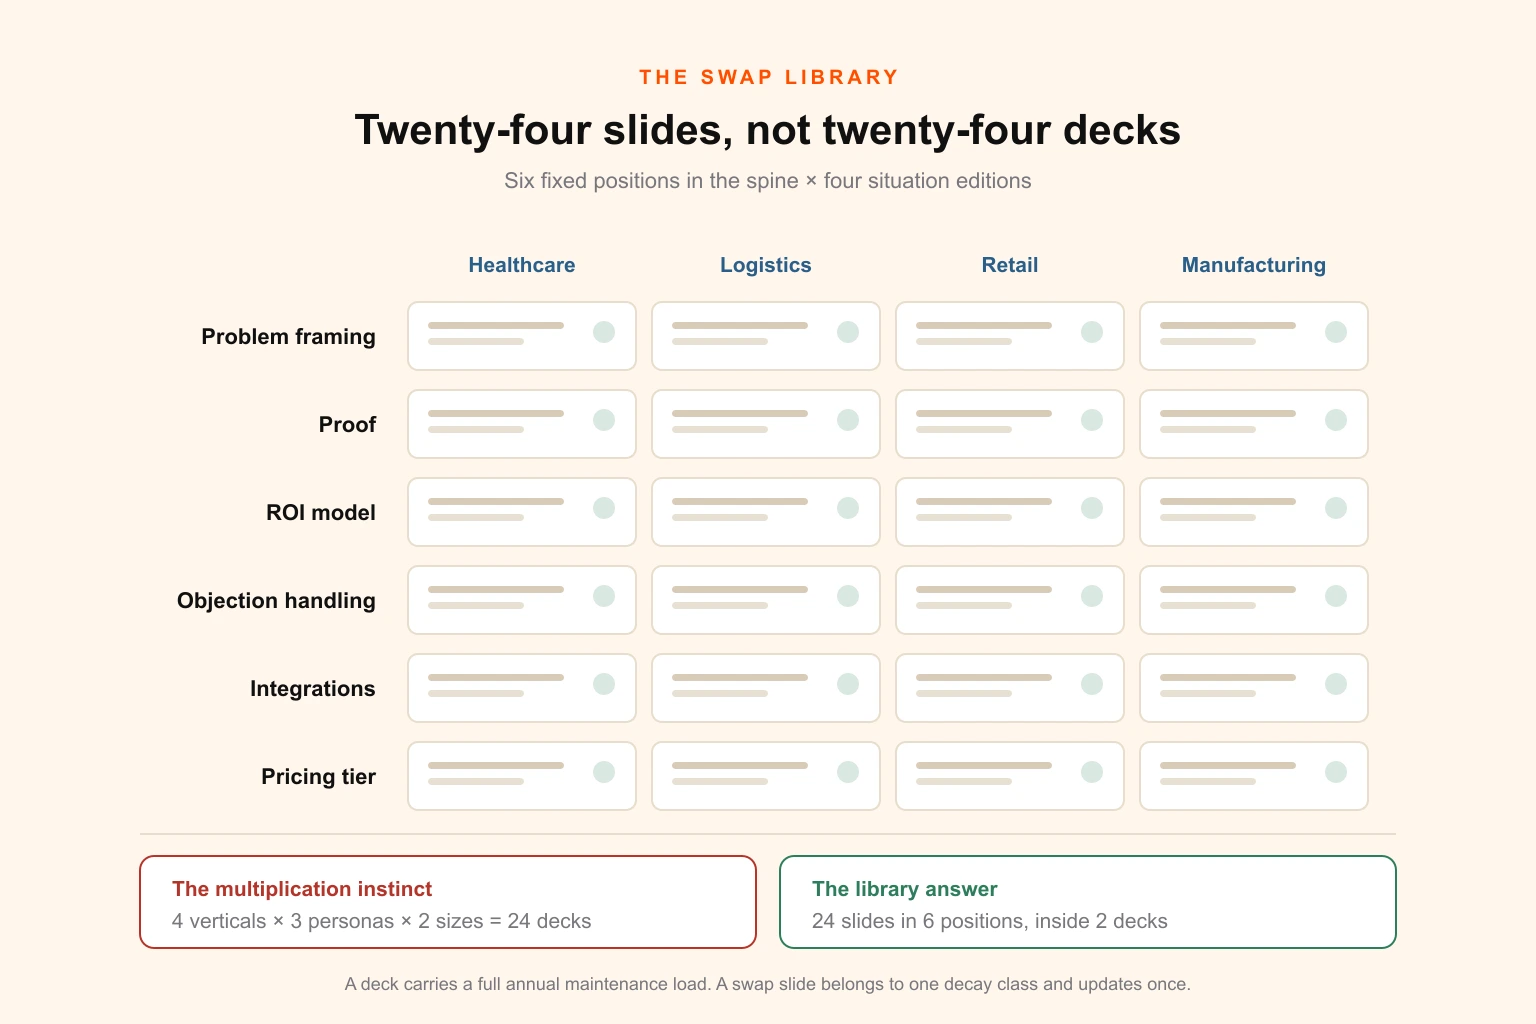
Six positions with four editions each is twenty-four slides, which is the same twenty-four the multiplication produced at the start of the meeting — except that it is twenty-four slides rather than twenty-four decks, and a slide belongs to exactly one decay class and gets updated exactly once when that class changes.
That is the whole trick. The library scales where decks do not.
For teams building this, the swap library is where a proper template system stops being a nicety. If the spine's master layouts are real — actual master slides with locked type styles and a defined grid, not a deck someone copies — a swap slide can be produced in twenty minutes by someone who is not a designer, and it will still be on brand. If they are not real, every swap slide is a small design job forever. The distinction between a template, a style guide and a full system is a genuine source of confusion and is worth resolving properly: design system vs style guide vs brand guidelines draws the lines, and brand guidelines covers what the document itself has to contain to be usable by non-designers.
So what is the number?
Two decks and a library, for almost every team below roughly thirty reps selling one product line.
One spine. Two delivery cuts of it. A swap library of somewhere between fifteen and forty slides covering the situations you actually encounter. That configuration serves nine or ten distinct sales situations, and it carries the maintenance load of — near enough — one deck, because the two cuts share every slide and the swap slides each update once.
The honest exceptions, in rough order of how often they are real:
- Genuinely different buyer problems. Selling the same platform to a practitioner who wants capability and to a CFO who wants consolidation is two arguments in two orders. That is a real fork.
- Multiple product lines with separate buying processes. Two products bought by different departments on different cycles are two spines, which is two decks, plus a third short one that explains why they are from the same company.
- A partner or channel motion. A deck a reseller presents without you in the room fails gate 3 hard, and usually gate 1 too, since the partner's buyer is often buying the partner rather than you. Teams running channel motions should also read the white-label side of this, because the constraints are the same ones a reseller faces.
- Regulated markets requiring reviewed claims. If a compliance function must approve claims, the reviewed deck is a different object with a different change process, and merging it with the unreviewed one will eventually cost you more than maintaining it.
Notice what is not on that list. Vertical is not on it. Deal size is not on it. Region is usually not on it, with the real exception of a language change, which is a translation of one deck rather than a second deck — though translation has its own maintenance multiplier that behaves exactly like a fork and should be counted as one.
What one deck costs to keep alive
Here is the number the whole decision turns on, and almost nobody calculates it.
Take a standard 18-slide B2B deck. Nobody is redesigning it. Nobody is rethinking the story. This is pure custodial work — keeping the facts on it true. Every slide belongs to a decay class, and each class changes at its own rate.
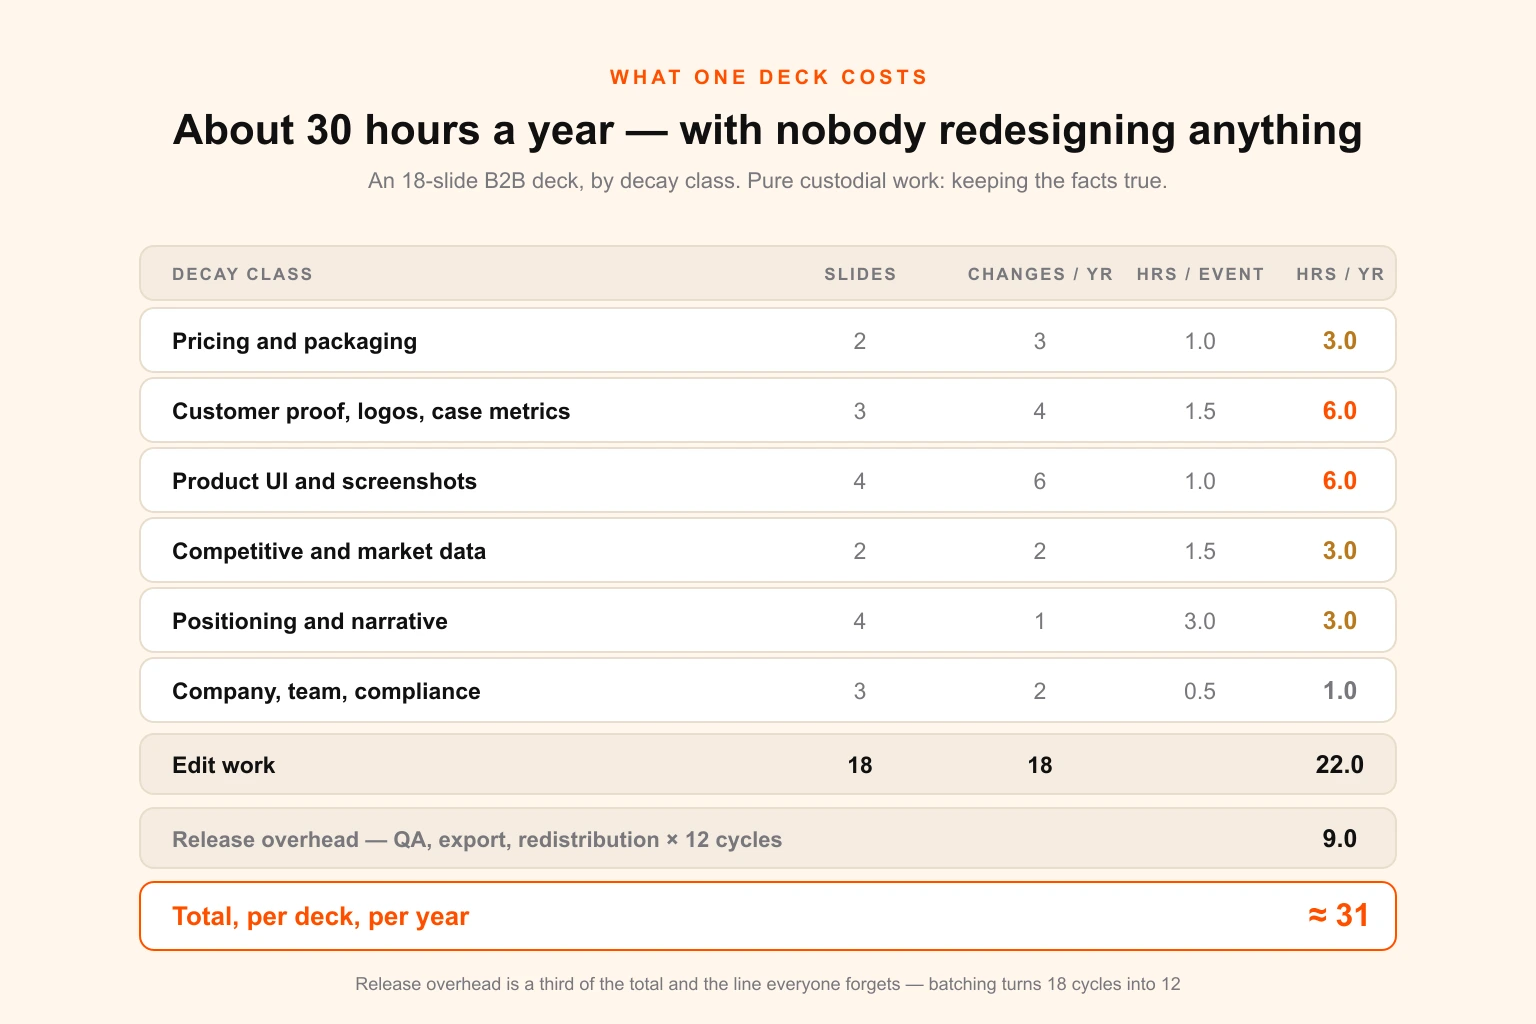
| Decay class | Slides | Change events / yr | Hours / event | Hours / yr |
|---|---|---|---|---|
| Pricing and packaging | 2 | 3 | 1.0 | 3.0 |
| Customer proof, logos, case metrics | 3 | 4 | 1.5 | 6.0 |
| Product UI and screenshots | 4 | 6 | 1.0 | 6.0 |
| Competitive and market data | 2 | 2 | 1.5 | 3.0 |
| Positioning and narrative | 4 | 1 | 3.0 | 3.0 |
| Company, team, compliance | 3 | 2 | 0.5 | 1.0 |
| Edit work | 18 | 18 | 22.0 | |
| Release overhead — QA, export, redistribution, 12 cycles | 0.75 | 9.0 | ||
| Total per deck per year | ≈ 31 |
Call it 30 hours per deck per year, and note what that number does not include: no redesign, no new slides, no response to a competitor's launch, no reaction to a repositioning. It is the cost of the deck merely continuing to be true.
Three things in that table are worth pausing on.
Product screenshots are the biggest single line and the most underestimated. Six refreshes a year is one every two months, which for a product shipping continuously is conservative rather than generous. They are also the class most likely to be silently wrong, because a screenshot that is one release out of date looks completely fine to everyone except the prospect who is currently looking at the actual product on another monitor.
Positioning changes once a year but costs three hours an event, because a positioning change is not an edit — it is a re-argument. It is also the one class where a change is a genuine trigger to revisit the spine rather than patch slides.
Release overhead is a third of the total and it is the line people forget entirely. Making the edit is not the work. Checking it did not break the layout, exporting both cuts, updating the canonical link, and telling ten people it changed — that is the work. It is also the line that batching fixes: eighteen change events handled individually is eighteen release cycles; batched into a monthly train it is twelve, and the twelve are cheaper each.
The division problem
Now the calculation that answers the original question:
Maintainable decks = annual hours your organisation actually spends on deck maintenance ÷ ~30 hours per deck per year
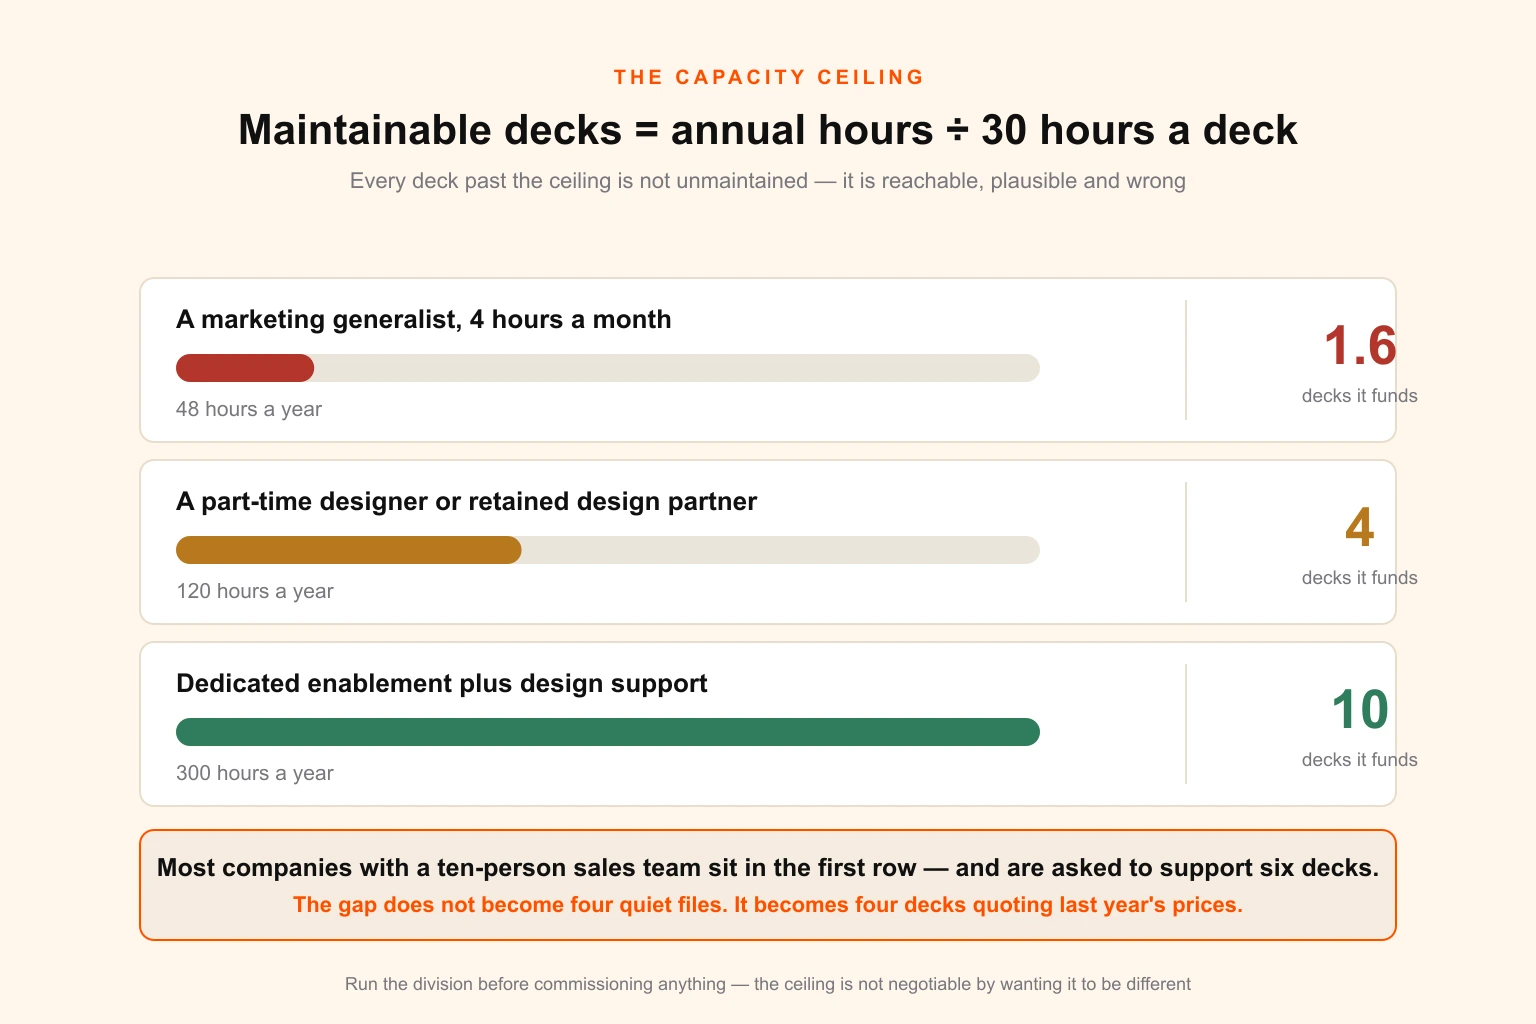
| Who maintains decks | Realistic hours / yr | Decks it funds |
|---|---|---|
| A marketing generalist, four hours a month | 48 | 1.6 |
| A part-time designer or retained design partner | 120 | 4 |
| Dedicated enablement plus design support | 300 | 10 |
The first row is where most companies with a ten-person sales team actually sit, and it is worth reading it back slowly. One and a half decks. That is the honest capacity of a very common configuration, and it is being asked to support six.
The gap between 1.6 and 6 does not manifest as four unmaintained decks sitting quietly in a folder. It manifests as four decks that are reachable, plausible-looking and wrong, being used by whichever rep found them, with your pricing on them. An unmaintained deck is not a neutral asset. It is negative.
This is the same shape of constraint that turns up everywhere production volume meets a fixed capacity — the arithmetic in how many ad creatives you actually need per month resolves the same way, with a hard ceiling that most plans quietly exceed, and the rebrand asset inventory is what the same problem looks like when the whole estate has to change at once instead of one slide at a time.
Why the second deck costs more than the first (and how to stop it)
There is a multiplier hiding in the maintenance number, and it is the single most consequential thing in this article.
Look back at the decay table. The four volatile classes — pricing, proof, product, competitive — account for 18 of the 22 edit hours, about 82 per cent. And those slides are identical across every fork. Your healthcare deck and your logistics deck have the same pricing. They show the same product. They cite the same competitive landscape.
So the question is whether those slides exist as independent copies or as links to one source.
If a slide is an independent copy in each of D decks, one pricing change costs D edits. Four decks means four edits, four QA passes, four chances to miss one — and it is always the fourth that goes to the prospect.
If the same slide is linked to a single source, one pricing change costs one edit and propagates.
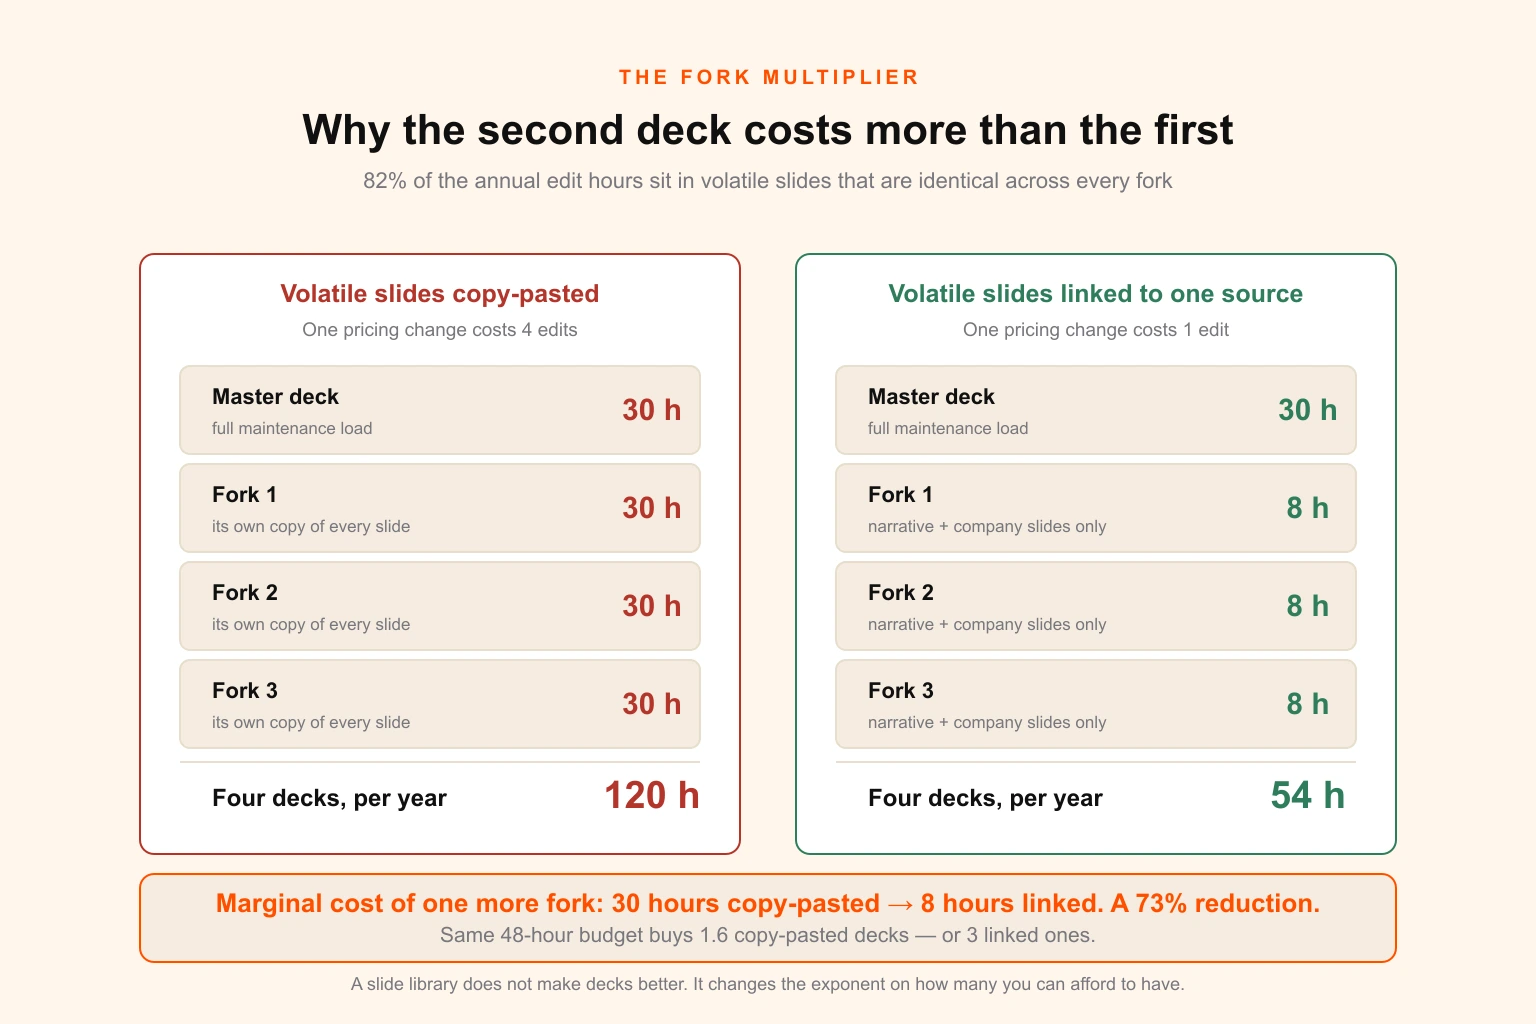
The arithmetic on four decks:
| Copy-pasted | Volatile slides linked | |
|---|---|---|
| Master deck | 30 h | 30 h |
| Each additional fork | 30 h | ~8 h |
| Four decks, total | 120 h / yr | ~55 h / yr |
The marginal cost of a fork drops from 30 hours to about 8 — a 73 per cent reduction — because all a linked fork carries is its own narrative slides, its own company furniture, and a share of release overhead.
Run that back through the capacity ceiling and the effect is stark. A team with 48 hours a year can maintain 1.6 copy-pasted decks, or 3 linked ones. Same people, same hours, nearly twice the coverage.
Which produces the honest case for a slide library, and it is not the case usually made for it. A slide library does not make your decks better. It does not make reps faster in any way they will thank you for. What it does is change the exponent on how many decks you can afford to have. That is the whole return, and it is large enough on its own.
The mechanics vary by tool and none of them are exotic. Google Slides has Link to source when you paste between presentations, and a linked slide can be updated in place from its origin. PowerPoint has slide libraries on SharePoint and, more crudely but effectively, linked OLE objects for the pricing table specifically. Enablement platforms — Highspot, Seismic, Showpad — do this natively and it is most of what you are paying them for. And every one of these mechanisms fails the same way: someone downloads a copy, edits it locally, and the link is severed silently. Which is the next problem.
The decks you did not authorise
Whatever number you settle on, it is not the number of decks in circulation. It is the number of decks in your circulation.
Reps localise. It is not indiscipline, it is the job: a rep with a big opportunity and a deck that is 80 per cent right will make it 100 per cent right, because ninety minutes of slide editing is trivially worth it against the deal. So they download the file, cut four slides, paste in the prospect's logo, adjust a number, and email it as an attachment.
That file now exists permanently, outside every update you will ever ship, containing your pricing and your customers' logos, on a stranger's mail server, and you cannot recall it.
Count them before you decide anything
Do not estimate this. It is countable, and the count is usually the most persuasive thing in the entire discussion:
- Search the CRM for attached presentation files on opportunities from the last two quarters. Count distinct filenames.
- Search the shared drive for files matching your deck's naming pattern, including the tell-tale suffixes —
v2,FINAL,_ACME,- edited, a rep's initials. - Ask three reps to open the deck they used last week, without warning. Whether it is the canonical one, and where they got it, tells you more than any survey.
The number that comes back is the real denominator. Every calculation in this article should be run against it, not against the tidy library you think you have.
Shadow decks are a demand signal
The instinct is to treat this as a compliance problem to be shut down. That is a mistake, and it also does not work.
A rep-made version is the cheapest market research you will ever get. It is a person with direct financial incentive telling you exactly which slide was missing. If three reps independently built the same vertical cut, that vertical has earned a sanctioned swap set — and note that what they earned is a swap set, not a deck.
So the move is to make the sanctioned path the easy path, which means three specific things:
- The appendix absorbs most of it. Most localisation is a rep needing one slide they do not have. Give it to them in an appendix and no file gets edited.
- Distribute links, not attachments. A link updates when you update it, tells you who opened it and for how long, and can be revoked. An attachment does none of those things. This is the single highest-leverage operational change on the list and it costs nothing but insistence.
- Give them a sanctioned way to customise. A prospect-logo slot and an editable agenda slide covers most of what reps are actually reaching for, and both can be built so that editing them does not sever any link.
There is a governance lesson here that generalises well beyond decks: the same dynamic — a distributed team, a central asset, and local edits nobody sees — is what makes multi-location brand compliance hard, and the resolutions are the same ones. Make the compliant path fast, and audit rather than trust.
The appendix: how to say no to a fork
Almost every request for a new deck version is, when you interrogate it, a request for one slide.
Can we get a version for healthcare? — usually means one compliance slide and three different logos. Can we get a version for enterprise? — usually means a security slide and an implementation timeline. Can we get a version for the CFO? — usually means one slide with a payback period on it.
The appendix is where those go, and treating it as a first-class part of the deck rather than a dumping ground is what keeps deck count flat.
An appendix works when it is built, indexed and rehearsed, not accumulated:
- Built means the slides are made to the same standard as the main deck, because a rep will jump to them mid-meeting and the seam will show.
- Indexed means there is a contents slide with hyperlinks, so a rep can reach any appendix slide in one click while a prospect watches. Without this the appendix is theoretically useful and practically unusable, because nobody scrolls through forty slides on a shared screen.
- Rehearsed means reps know what is in there. An appendix nobody has read is identical to no appendix.
Appendix depth is also the correct answer to deal size, which is one of the multipliers people most often try to solve with a fork. An enterprise deal does not need a different argument; it needs the same argument plus twelve slides of security, procurement, implementation and reference detail that a small deal never asks for. That is a deeper appendix, not another deck.
The one genuine constraint: an appendix has a maintenance cost too, at roughly the rate of its decay class. Twelve appendix slides is not free. But twelve appendix slides on one deck is dramatically cheaper than twelve slides plus a full narrative in a second file, and — critically — an appendix slide that goes stale is one nobody jumped to, whereas a stale deck gets presented start to finish.
The staleness audit
You cannot manage this without measuring it, and the measurement is simple enough to run in an afternoon.
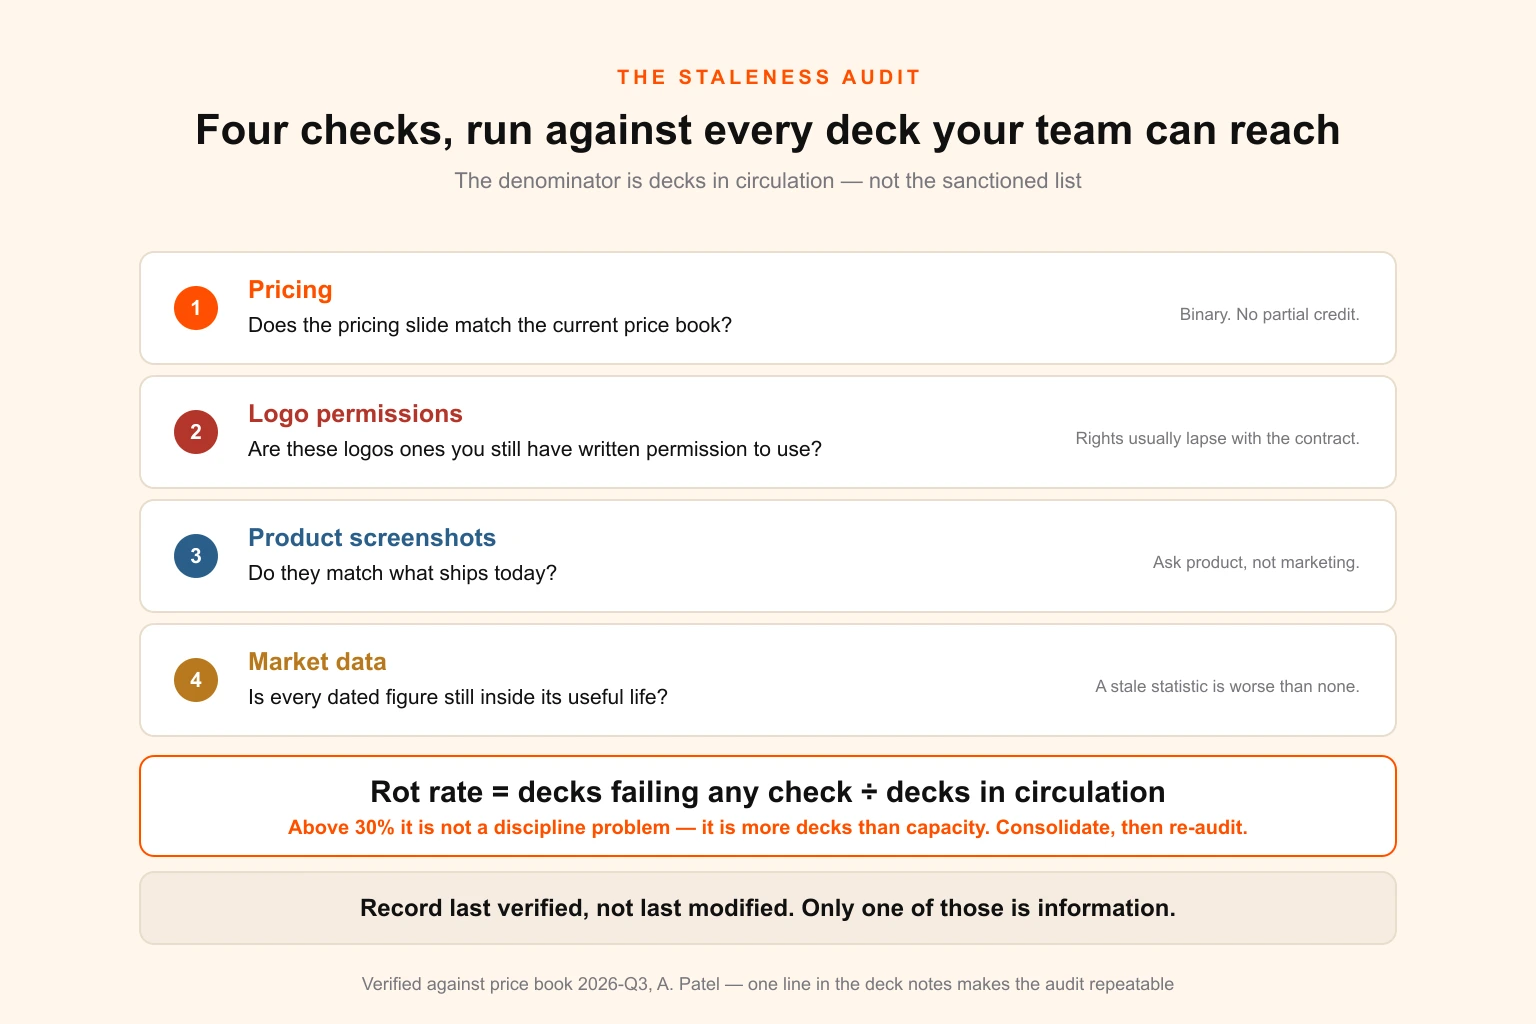
For every deck your team can reach — the real denominator from the shadow-deck count, not the sanctioned list — check four things:
1. Does the pricing slide match the current price book? Binary. No partial credit. Failing this is the one that costs money directly, either in a discount you did not intend to offer or in a credibility loss when the quote does not match the deck.
2. Are the customer logos ones you still have permission to use? This is the sharpest edge in the whole audit and the one most often missed. Customer logo usage is generally granted by a specific clause in the contract or a separate reference agreement, and that permission commonly lapses when the contract does. A deck untouched for eighteen months is very likely displaying at least one logo you no longer have the right to display, quite possibly to a prospect who knows that company well enough to mention it. Treat the proof slide as a permissions asset with an expiry, keep written approvals somewhere findable, and review quarterly against the live reference list. Anyone who has dealt with font licensing or stock asset licensing across print runs and merchandise will recognise the pattern exactly: usage rights are scoped and time-boxed, and the asset itself carries no memory of its own terms.
3. Do the product screenshots match what ships today? Get someone from product to look, not someone from marketing. Marketing recognises the screenshot; product recognises the version.
4. Is the market or competitive data still inside its useful life? Anything with a year in it, any market size figure, any competitor claim. A statistic from three years ago presented as current does more damage than no statistic, and it is the kind of thing a well-prepared buyer checks. If you are refreshing this class of slide, the 2026 graphic design statistics roundup is an example of the format worth citing from — sourced, dated, and traceable to an origin.
Then compute:
Rot rate = decks failing any check ÷ decks in circulation
Above roughly 30 per cent, stop treating it as a discipline problem. A rot rate that high is a structural signal that you have more decks than capacity, and no amount of reminding people will fix an arithmetic shortfall. Consolidate first, then re-audit.
And record last verified, not last modified. Last modified tells you somebody opened the file and changed a typeface. Last verified tells you somebody checked the pricing against the price book. Only one of those is information. A single line in the deck's own notes — verified against price book 2026-Q3, A. Patel — costs nothing and makes the audit repeatable.
The operating model
Architecture without an operating model decays back into a folder full of files within about two quarters. The model that holds is unglamorous and short.
One canonical location, and it is a link. One URL per deck, per cut. Everything else — every attachment, every local copy — is by definition unofficial. Reps send the link. This is worth being genuinely rigid about, because it is what makes every other control possible: you cannot version, revoke, or measure an attachment.
A monthly release train. Batch changes rather than shipping them one at a time. Same day each month, a short note saying what changed, the appendix and swap library included. Batching is what turns eighteen release cycles into twelve and makes the release overhead line in the maintenance table affordable. The exception that jumps the train is pricing — a pricing change ships immediately, because the cost of a stale price is asymmetric.
Two-part version numbers. Major for a narrative change, minor for a content refresh. v3.2 means the third spine, second refresh. This matters mainly because it tells a rep at a glance whether they need to re-learn the deck or just re-download it, which is the actual decision they are making.
A named owner per deck, reconfirmed quarterly. The gate-four name from the fork test is not a one-time formality — it lapses. People change roles. A quarterly reconfirmation is a five-minute exercise that surfaces orphaned decks before the audit does.
A kill rule. Any fork with no named owner, or no recorded use in 90 days, gets archived — moved somewhere reps cannot reach and marked clearly. Not deleted, archived. The reason to write the rule down in advance is that killing a deck someone commissioned is politically hard in the moment and easy when it is a policy agreed beforehand. If you are going through a larger clear-out — a rebrand, an agency transition — the design agency offboarding checklist covers the mechanics of retiring assets cleanly, including the source files you need to hold on to.
A trigger list, not a calendar. Some updates are scheduled and some are events. The events that should automatically open a deck: a pricing change, a funding announcement, a logo becoming unusable, a product release that changes the UI, a competitor launch that invalidates a claim, and a positioning change. That last one is the largest, and if you are in the middle of it, the 90-day brand rollout sequences the whole estate rather than just the decks.
Worked example: the ten-person sales team
Putting it together for a concrete case, because the general rules are easier to trust once you have seen them resolve.
A B2B software company. Ten reps, four verticals, two buyer types, deals from $15k to $200k, one product line, series-A-ish and shipping continuously.
What the multiplication instinct produces: four verticals × two buyer types × two deal sizes = 16 decks. Negotiated down to six.
What the fork test produces:
- Verticals fail gate 1 and gate 2 — same problem, same argument order. Not decks. → swap slides
- Deal size fails gate 2 — same argument, more detail. → appendix depth
- Buyer type: the practitioner and the CFO have genuinely different problems and the argument runs in a different order for each. Gates 1 and 2 pass. Gate 3 — usually the same rep presenting. Gate 4 — one owner can be named for both. → one fork, marginal
- Delivery mode passes cleanly. → two cuts
Result: two decks, one marginal third, plus a library.
- Deck 1 — the spine, presented cut, ~12 slides plus appendix
- Deck 2 — the spine, send-ahead cut, same slides plus the narration layer
- Optional Deck 3 — the economic-buyer cut, forked only when the CFO conversation is a distinct meeting rather than four slides inside the main one
- Library — around 24 swap slides across six positions
- Appendix — roughly 14 slides, indexed and hyperlinked
The maintenance bill: with volatile slides linked, deck 1 and deck 2 share nearly everything, so the pair costs roughly one deck's load — about 32 hours a year including the extra export. The swap library adds around 10 hours a year, because each slide sits in one decay class and updates once. The appendix adds about 6. Total ≈ 48 hours a year, which is exactly what a marketing generalist giving decks four hours a month can carry.
The six-deck plan, copy-pasted, would have been about 180 hours. The same team would have maintained two of them.
That is the entire argument in two numbers.
What this costs, and who does it
There are three costs in a deck system, and they get quoted as one, which is why the budgeting usually goes wrong.
The build. The spine, the master template, the two cuts, the narration layer, the initial swap library, the appendix. This is a defined project with an end. For a single-product B2B team it is typically a few thousand; more where serious data visualisation, custom charting or a broader brand system comes with it. Market ranges for this and every other deliverable are in the graphic design pricing guide.
The maintenance. The 30-odd hours per maintained deck per year, forever. This is where the actual money goes and it is almost never in the plan. It is also the number that decides your deck count, which is why it is worth calculating before you commission anything.
Change latency. The days between a pricing decision being made and a rep opening the current deck. On a per-project arrangement that is a scope conversation, a quote, an approval and a queue — realistically one to three weeks, during which every rep is presenting the old number. On a retained or subscription arrangement it collapses to a turnaround. Latency is the cost nobody quotes and the one that most directly affects revenue, because a deck that is right three weeks late was wrong for three weeks.
That third number is why deck work fits a subscription model unusually well. The demand is unpredictable in composition — you cannot forecast which slide breaks — and completely predictable in volume, at roughly eighteen change events a year per deck. That is a bad shape for per-asset pricing and a good shape for a queue.
Digital Polo runs presentation work as a fixed monthly cost rather than per asset, on the same queue as everything else the business needs, which for most companies means the deck sits alongside the sales one-pagers, the case study template, the event graphics and the paid creative. Presentation and pitch deck design covers the build end — spine, master template, both cuts, native source files in PowerPoint, Google Slides or Keynote — and the custodial work afterwards is just more tickets on the same queue. Plans are $399 and $899 a month, and how the model works in practice covers scope, turnaround and what a queue does and does not absorb.
The choice against alternatives is genuinely situational. A dedicated in-house designer makes sense when deck work is continuous and sits alongside enough other design demand to fill a role — unlimited graphic design vs hiring a full-time designer runs that comparison against real utilisation numbers. A freelancer suits a one-off build and is a poor fit for custodial work, which is exactly the shape covered in unlimited graphic design vs freelancers. And if the current arrangement is a marketing generalist in Canva doing this alongside four other jobs, the failure mode is well documented in what happens when a business outgrows Canva and a virtual assistant — which is, more often than not, precisely the configuration producing the six decks and the 1.6-deck capacity.
For teams where the deck is one asset in a much larger set, the inventory question is worth running properly first: SaaS companies and startups both tend to discover the deck is 15 per cent of a problem they were treating as 100 per cent of one, and the employer brand asset kit and internal communications design usually surface as the neglected remainder.
Next steps
In order, and none of these take longer than an afternoon:
- Count the decks actually in circulation. CRM attachments, drive search, three reps asked without warning. This is your denominator and it is usually two to three times the sanctioned number.
- Run the staleness audit on all of them. Pricing, logo permissions, screenshots, market data. Compute the rot rate.
- Run the fork test on every deck that exists. Four gates, all four required. Expect most to fail on gate 4.
- Calculate your capacity. Honest hours per year, divided by 30. That is your ceiling and it is not negotiable by wanting it to be different.
- Consolidate down to the ceiling. Spine, two cuts, swap library, indexed appendix. Archive the rest under a written kill rule.
- Link the volatile slides. Pricing, proof, product, competitive. This is what makes the third and fourth deck affordable if you ever genuinely need them.
- Switch to links, stop sending attachments. Nothing else on this list works without it.
The number you are looking for is almost certainly two. The work is in making two enough — and in accepting that the alternative was never six well-maintained decks, it was two well-maintained decks and four quiet liabilities with your pricing on them.