
Nobody asks this question until it is already a problem.
It arrives about six weeks into a scaling push, usually as a complaint dressed up as a request. Performance has drifted. The media buyer says the account needs more creative. The founder or the client asks the only reasonable question available to them — how many — and gets back a number that came from a table on somebody's blog, keyed to monthly ad spend, with no reasoning attached. Then a brief goes out for thirty creatives, the design team quietly discovers that thirty creatives means about two hundred files, half of them ship late, and the ones that ship get five days of delivery each on a budget that could never have told anyone whether they worked.
That whole sequence is a planning failure, not a design failure. And it repeats because the standard answer to this question is wrong in a specific way: it treats creative volume as a function of spend, when spend is only one of two constraints, and usually not the binding one.

The genuinely useful sources on this — Foxwell Digital's volume-by-spend breakdown among them — get the shape right and stop one step early. They tell you the number. They do not tell you how to derive your own, they do not reconcile it against what your budget can actually learn from, and they say nothing at all about the two things that decide whether you can execute against it: how many files that number really is, and how many hours those files take.
This is the full version. Two models that produce the number from your own account, the reconciliation when they disagree, the file multiplier nobody prices in, the production arithmetic, and the point where the requirement stops fitting inside one person.
The three numbers everyone conflates
Before any arithmetic, a definitional problem has to be cleared, because it is responsible for more blown creative budgets than any other single thing in paid social.
There are three different units in this conversation, and almost every brief uses one word for all of them.
A concept is an angle. A claim, a hook, a proof point, an objection handled, a reason to care. "Founder explains why we built it" is a concept. "Side-by-side against the incumbent" is a concept. Concepts are the strategic unit, they are where the real thinking lives, and you need far fewer of them than you think.
A variant is one execution of a concept. Same angle, different hook line, different opening frame, different visual treatment, different proof. This is the unit you actually test, and when a media buyer says "we need thirty creatives," this is almost always what they mean.
A file is one variant rendered at one aspect ratio for one placement on one platform. This is the only unit that ever reaches a designer, and it is the unit that consumes hours and money.
The ratios between them are stable enough to plan against. One concept reliably yields four to six variants before it starts repeating itself. One variant becomes two or three files on Meta alone, and seven to nine files if you are also running TikTok and Performance Max.
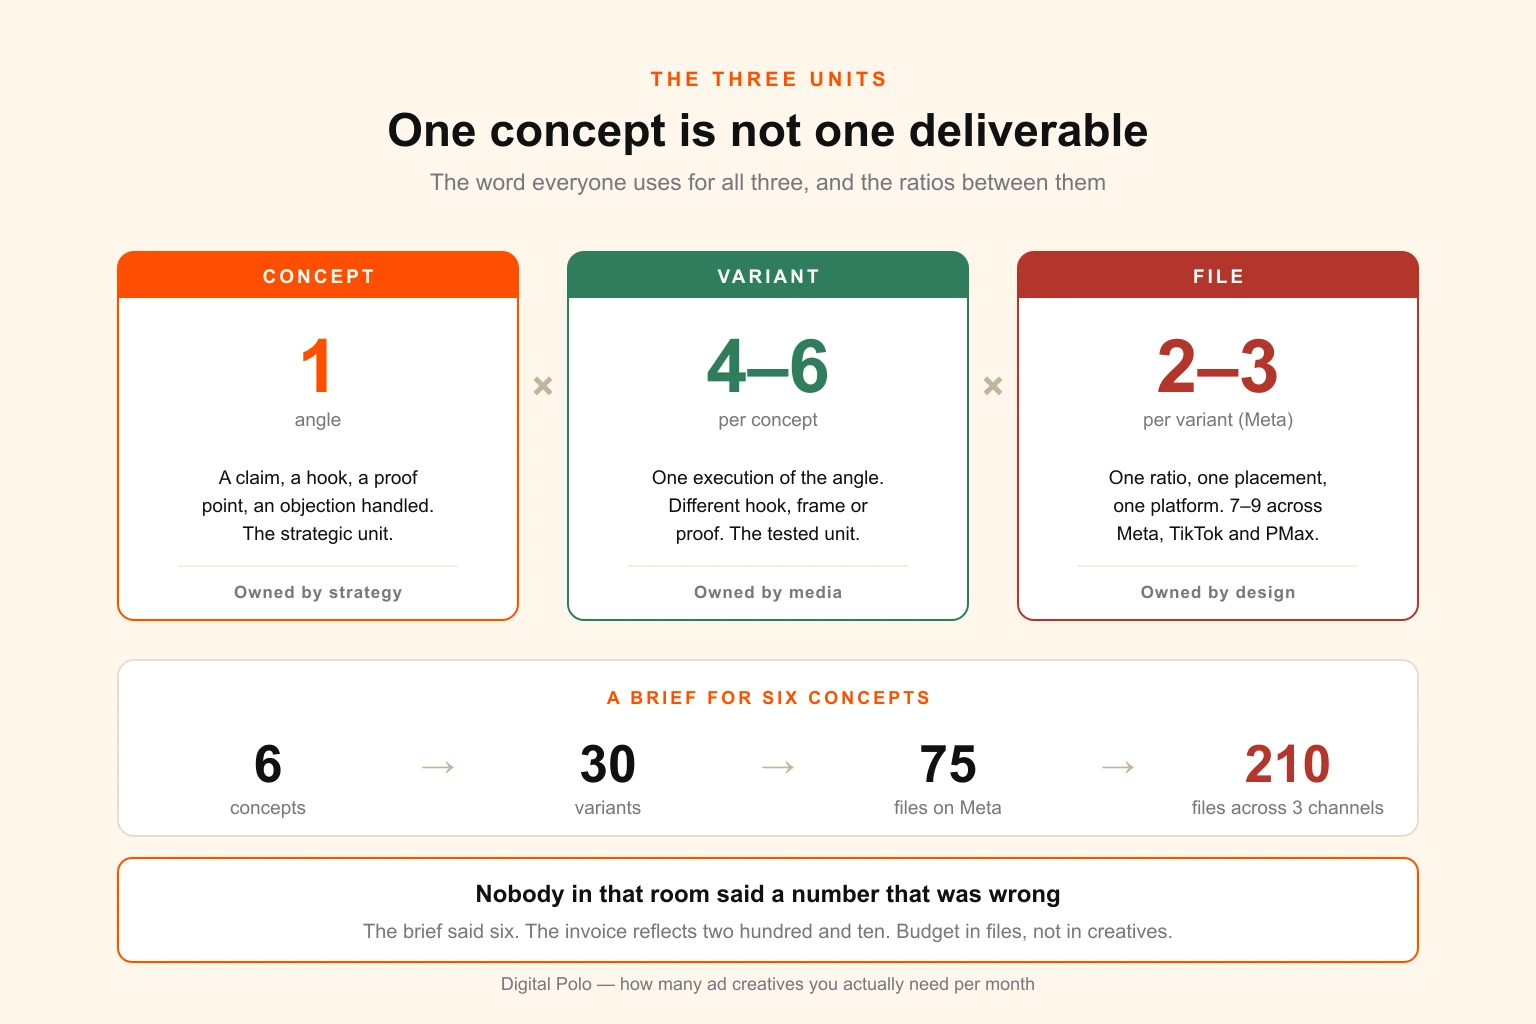
Run it forward and the scale of the misunderstanding becomes obvious. Six concepts is thirty variants. Thirty variants on Meta is seventy-five files. Thirty variants across Meta, TikTok and Performance Max is around two hundred and ten. A request that sounded like "six ideas" is a two-hundred-file production month, and nobody in the room said a number that was wrong.
This is the same multiplication problem that shows up whenever a single asset has to cover a lot of surfaces — turning one campaign asset into fifteen channel formats walks through the ratio families and safe areas in detail, and it is worth reading alongside this if you are the person who has to actually build the kit.
For the rest of this article, when a number is a variant count it says so, and when it is a file count it says so. The distinction is the whole game.
Model one: how much creative can your spend actually read?
Start here rather than with a table, because this calculation frequently produces a smaller number than anyone expects and it is the one that cannot be argued with.
A creative you cannot read is not a test. It is a file you paid to make and paid to serve, and it produced no information in either direction. The amount of spend a creative needs before it becomes legible is a function of your cost per acquisition, and it is higher than most accounts assume.
Two thresholds matter:
The kill threshold is roughly three to five times your target CPA. Below this, a creative with zero conversions tells you nothing — that outcome is entirely consistent with a good creative that got unlucky. Above it, a zero is real information and you can turn the creative off without regret.
The promote threshold is roughly fifteen to twenty-five times target CPA. This is what a creative needs before you should shift meaningful budget behind it, because below it you are scaling a small-sample fluke about as often as you are scaling a winner.
From the kill threshold you get the ceiling:
Readable creatives per month = (monthly spend × testing allocation) ÷ (kill threshold × target CPA)
Testing allocation is the share of budget you are willing to put behind unproven creative — 15 to 30 per cent in most healthy accounts, which is roughly what the 70:20:10 heuristic implies once you account for iterations.
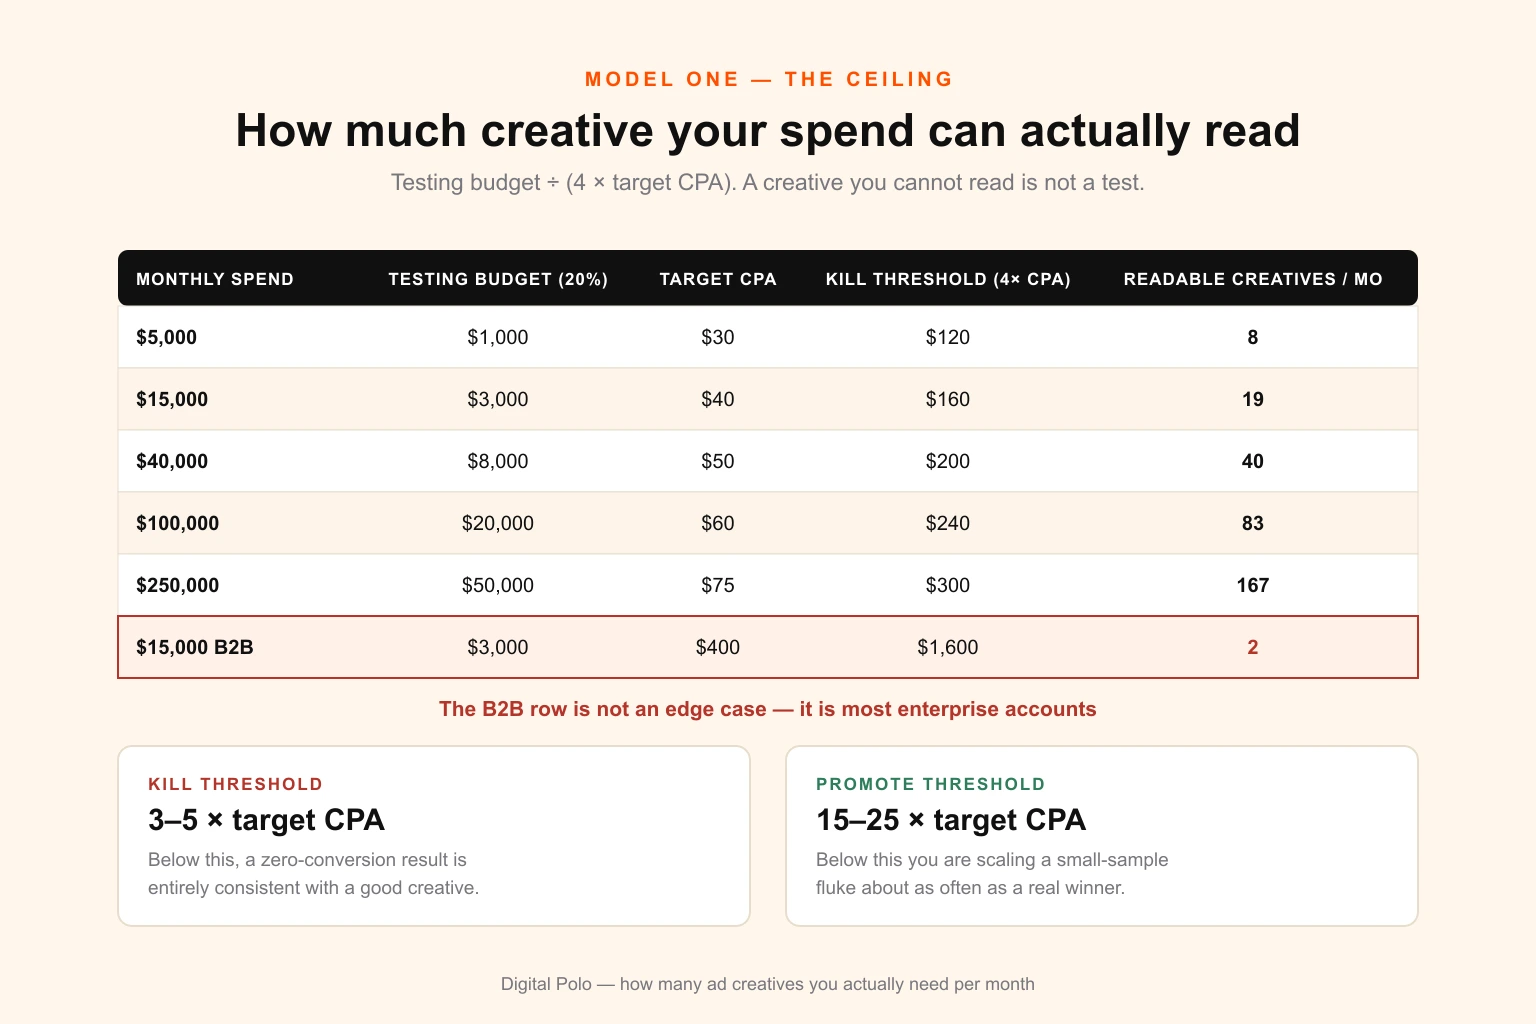
| Monthly spend | Testing budget (20%) | Target CPA | Kill threshold (4× CPA) | Readable creatives / month |
|---|---|---|---|---|
| $5,000 | $1,000 | $30 | $120 | 8 |
| $15,000 | $3,000 | $40 | $160 | 19 |
| $40,000 | $8,000 | $50 | $200 | 40 |
| $100,000 | $20,000 | $60 | $240 | 83 |
| $250,000 | $50,000 | $75 | $300 | 167 |
Now the row that changes how B2B accounts should plan. At $15,000 a month with a $400 CPA — an entirely ordinary enterprise software figure — the kill threshold is $1,600, the testing budget is $3,000, and the account can read two creatives a month. Not fifteen. Two.
This is why B2B paid social teams who copy DTC creative cadences get nothing back for the effort. The fix is not more production. It is to test at the concept level rather than the variant level, to judge on upper-funnel proxies that accumulate signal far faster than conversions do — hook rate, hold rate, click-through rate, cost per landing page view — and to put the available hours into fewer assets built properly. A SaaS account running feature launches, decks and paid social off one queue is usually better served by four excellent concepts a quarter than by thirty mediocre variants a month.
Model two: how many tests does your hit rate demand?
The first model gives you a ceiling. This one gives you a floor, and it is derived entirely from numbers already sitting in your ad account.
Three inputs:
Live winner slots. How many proven creatives you want carrying delivery at any moment. Three to five for most accounts — enough that no single fatiguing asset can crater the week.
Winner lifespan. How long a winner stays a winner before fatigue retires it. Pull this from history rather than guessing; it usually falls between four and twelve weeks and it shortens as spend rises.
Hit rate. The share of tested variants that beat control. Ten to twenty-five per cent is the normal band, and most accounts sit nearer ten than twenty-five.
Tests per month = (winner slots ÷ winner lifespan in months) ÷ hit rate
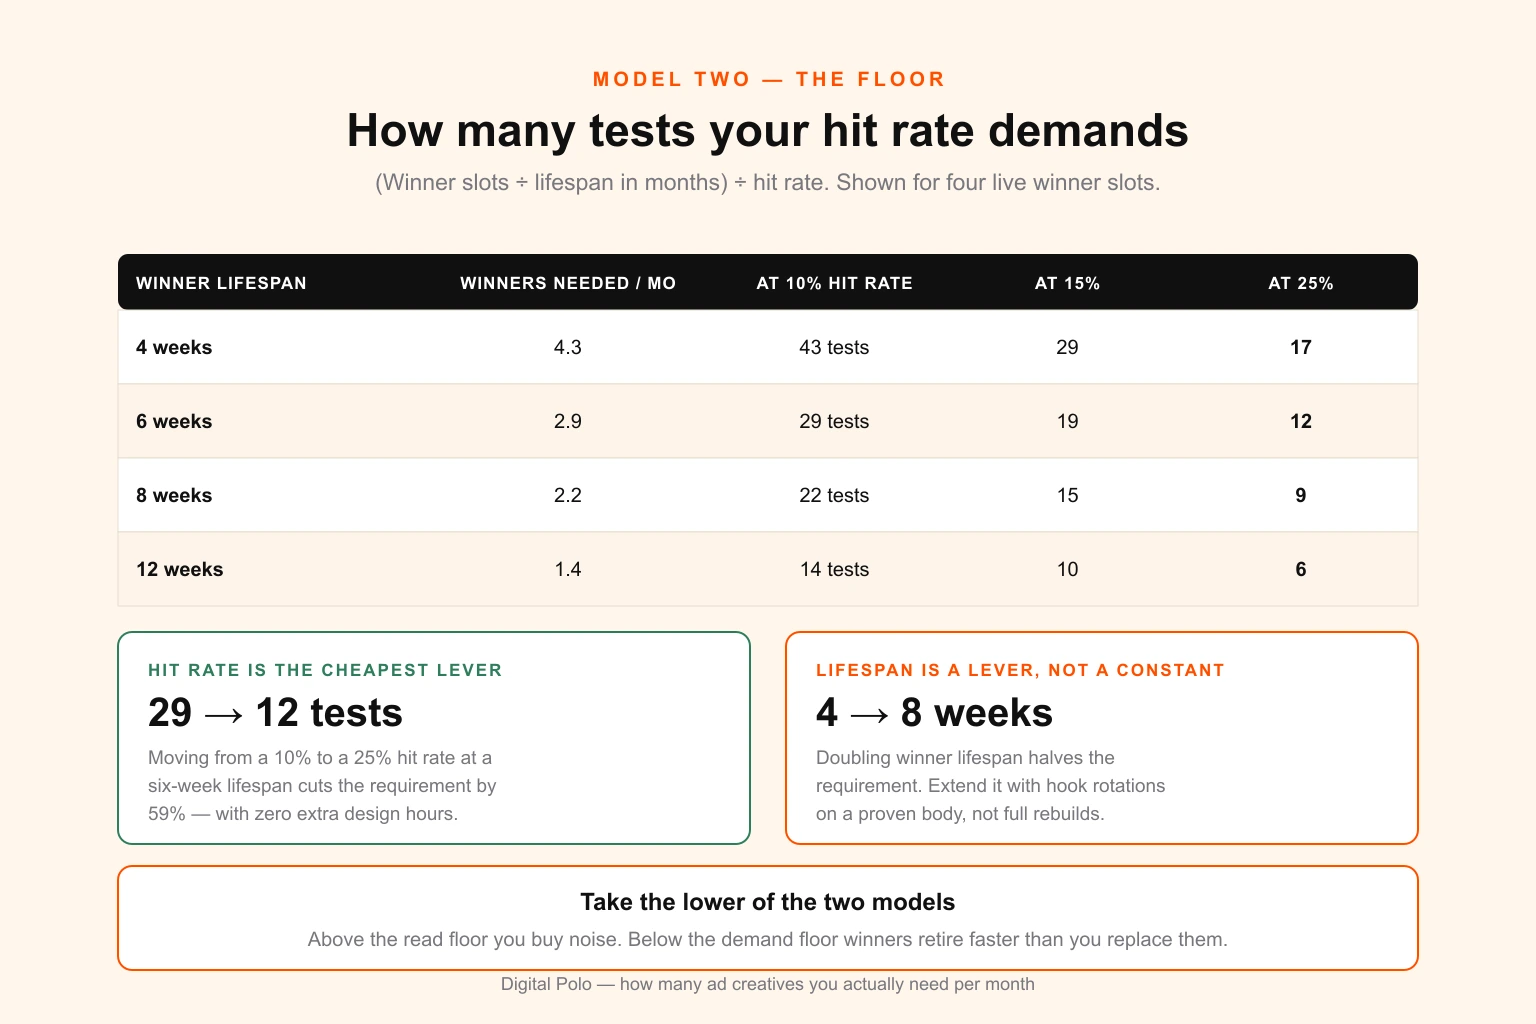
With four live winner slots:
| Winner lifespan | Winners needed / month | @ 10% hit rate | @ 15% | @ 25% |
|---|---|---|---|---|
| 4 weeks | 4.3 | 43 tests | 29 | 17 |
| 6 weeks | 2.9 | 29 tests | 19 | 12 |
| 8 weeks | 2.2 | 22 tests | 15 | 9 |
| 12 weeks | 1.4 | 14 tests | 10 | 6 |
Two things fall out of this table that a spend-keyed table can never tell you.
The first is that hit rate is worth more than production capacity. Moving from a 10 per cent hit rate to 25 per cent at a six-week lifespan cuts the requirement from 29 tests a month to 12. That is a 59 per cent reduction in production volume achieved with no additional design hours whatsoever — bought instead with better concepting, sharper briefs and honest post-mortems on why losers lost. If you are choosing between hiring more production capacity and investing in the quality of what gets briefed, this is the arithmetic that says brief quality wins. It is also the strongest practical argument for taking the design brief itself seriously rather than treating it as a ticket.
The second is that winner lifespan is a lever, not a constant. Doubling lifespan from four weeks to eight halves the requirement. Lifespan is extended by broader targeting, by rotating hooks on a proven body rather than rebuilding the whole asset, and by not running the same creative into a frequency wall out of inertia.
Reconciling the two, which is where the real answer lives
Now run both models and compare.
Take a DTC account at $40,000 a month, $50 target CPA, 20 per cent testing allocation, four winner slots, six-week lifespan, 12 per cent hit rate.
- Read-floor model: $8,000 testing budget ÷ $200 kill threshold = 40 readable creatives a month.
- Winner-replacement model: 2.9 winners needed ÷ 0.12 = 24 tests a month.
Here the demand model binds. Twenty-four is the number, and the spare read capacity is genuinely spare — useful headroom to put more spend behind each test and reach the promote threshold faster, which is a better use of it than manufacturing sixteen more variants nobody needs.
Now the same shape at a B2B account: $15,000 a month, $400 CPA, four winner slots, ten-week lifespan, 15 per cent hit rate.
- Read-floor model: $3,000 ÷ $1,600 = 2 readable creatives a month.
- Winner-replacement model: 1.7 winners ÷ 0.15 = 11 tests a month.
Here the read floor binds, hard, and the gap is a trap. Produce eleven and you get eleven illegible results, a design bill, and no more knowledge than you started with. The correct response is not to produce eleven. It is to accept two properly-funded tests a month, judge them on proxy metrics that mature faster than CPA, and reallocate the design hours you just saved into something with a real return — better landing pages, a stronger sales deck, the asset system that supports the rest of the funnel.
The rule: take the lower of the two numbers. Producing above the read floor buys noise. Producing below the demand floor means winners retire faster than you replace them and the account bleeds out slowly over a quarter.
The planning table, with the columns that are usually missing
With both models understood, a spend-keyed table becomes useful again — as a sanity check on the output of your own arithmetic rather than as a substitute for it. This one carries the columns that actually let you resource the work.
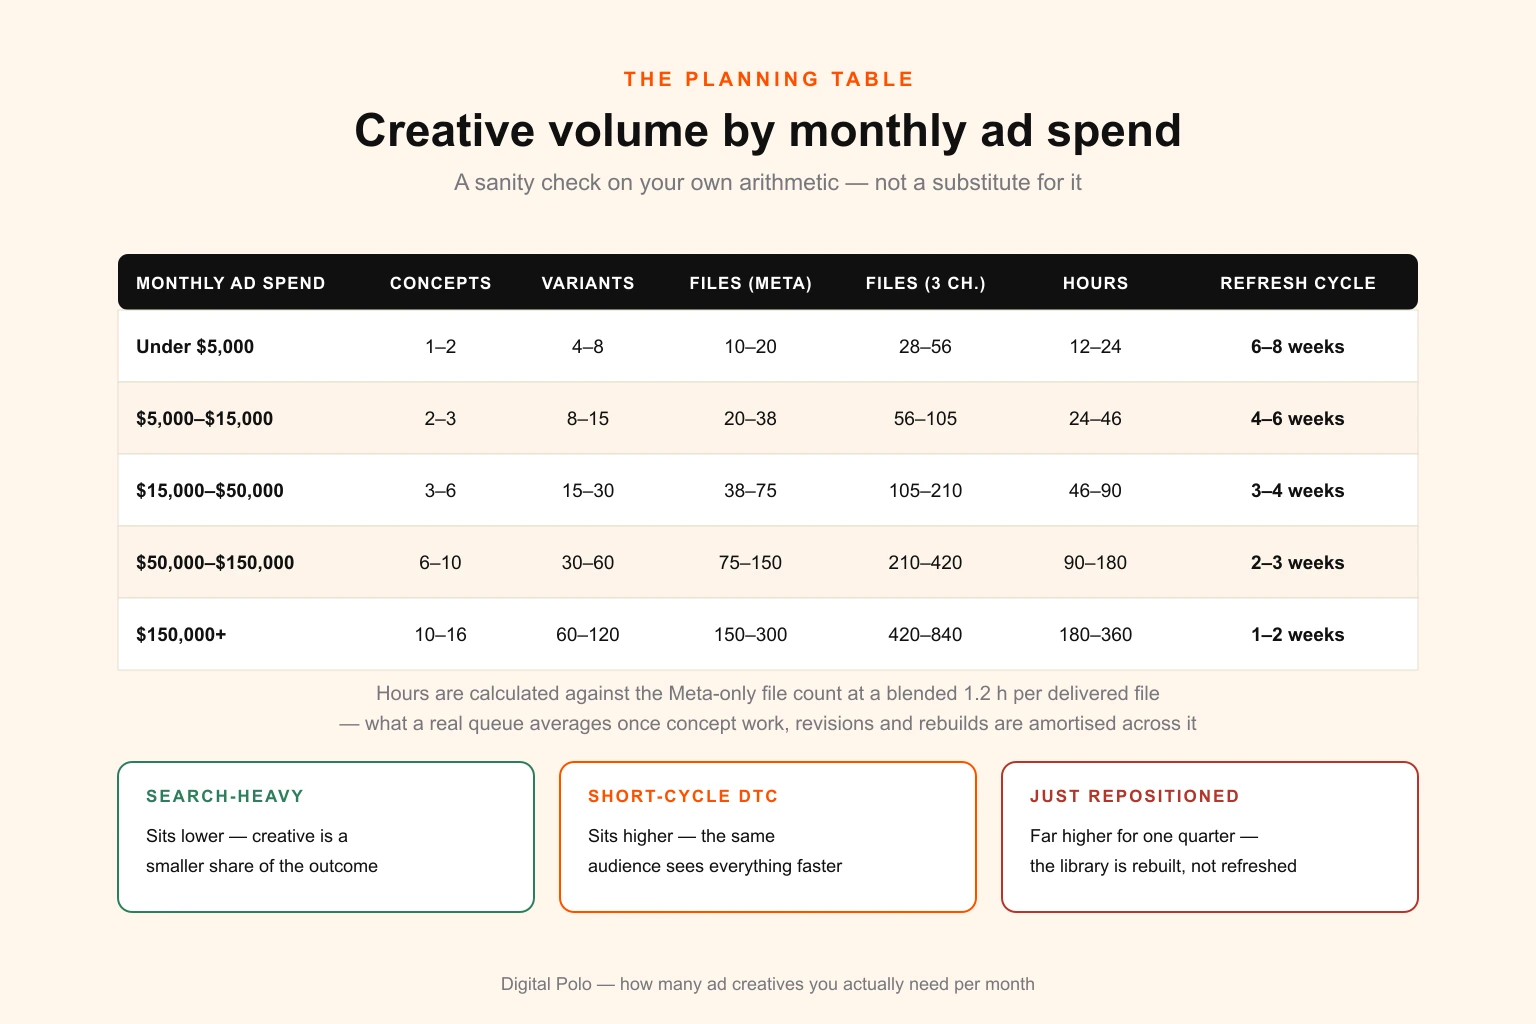
| Monthly ad spend | Concepts | Variants | Files (Meta only) | Files (3 channels) | Production hours | Refresh cycle |
|---|---|---|---|---|---|---|
| Under $5,000 | 1–2 | 4–8 | 10–20 | 28–56 | 12–24 | 6–8 weeks |
| $5,000–$15,000 | 2–3 | 8–15 | 20–38 | 56–105 | 24–46 | 4–6 weeks |
| $15,000–$50,000 | 3–6 | 15–30 | 38–75 | 105–210 | 46–90 | 3–4 weeks |
| $50,000–$150,000 | 6–10 | 30–60 | 75–150 | 210–420 | 90–180 | 2–3 weeks |
| $150,000+ | 10–16 | 60–120 | 150–300 | 420–840 | 180–360 | 1–2 weeks |
The production hours column is calculated against the Meta-only file count at a blended 1.2 hours per delivered file. That blend is what a real queue averages once concept development, revision rounds and the occasional full rebuild are amortised across everything that ships — it is not the time to resize a static, and treating it as though it were is how design timelines get set by people who have never run the queue.
Three caveats on the bands themselves. Search-heavy accounts sit lower than these figures because creative is a smaller share of what determines outcome. Short-cycle DTC with a narrow catalogue sits higher because the same audience sees everything faster. And accounts that have just changed positioning sit far higher for one quarter, because the concept library has to be rebuilt rather than refreshed.
The file multiplier, priced properly
The gap between the two file columns above is where creative budgets actually die, and it is worth breaking out because almost nobody accounts for it at briefing time.
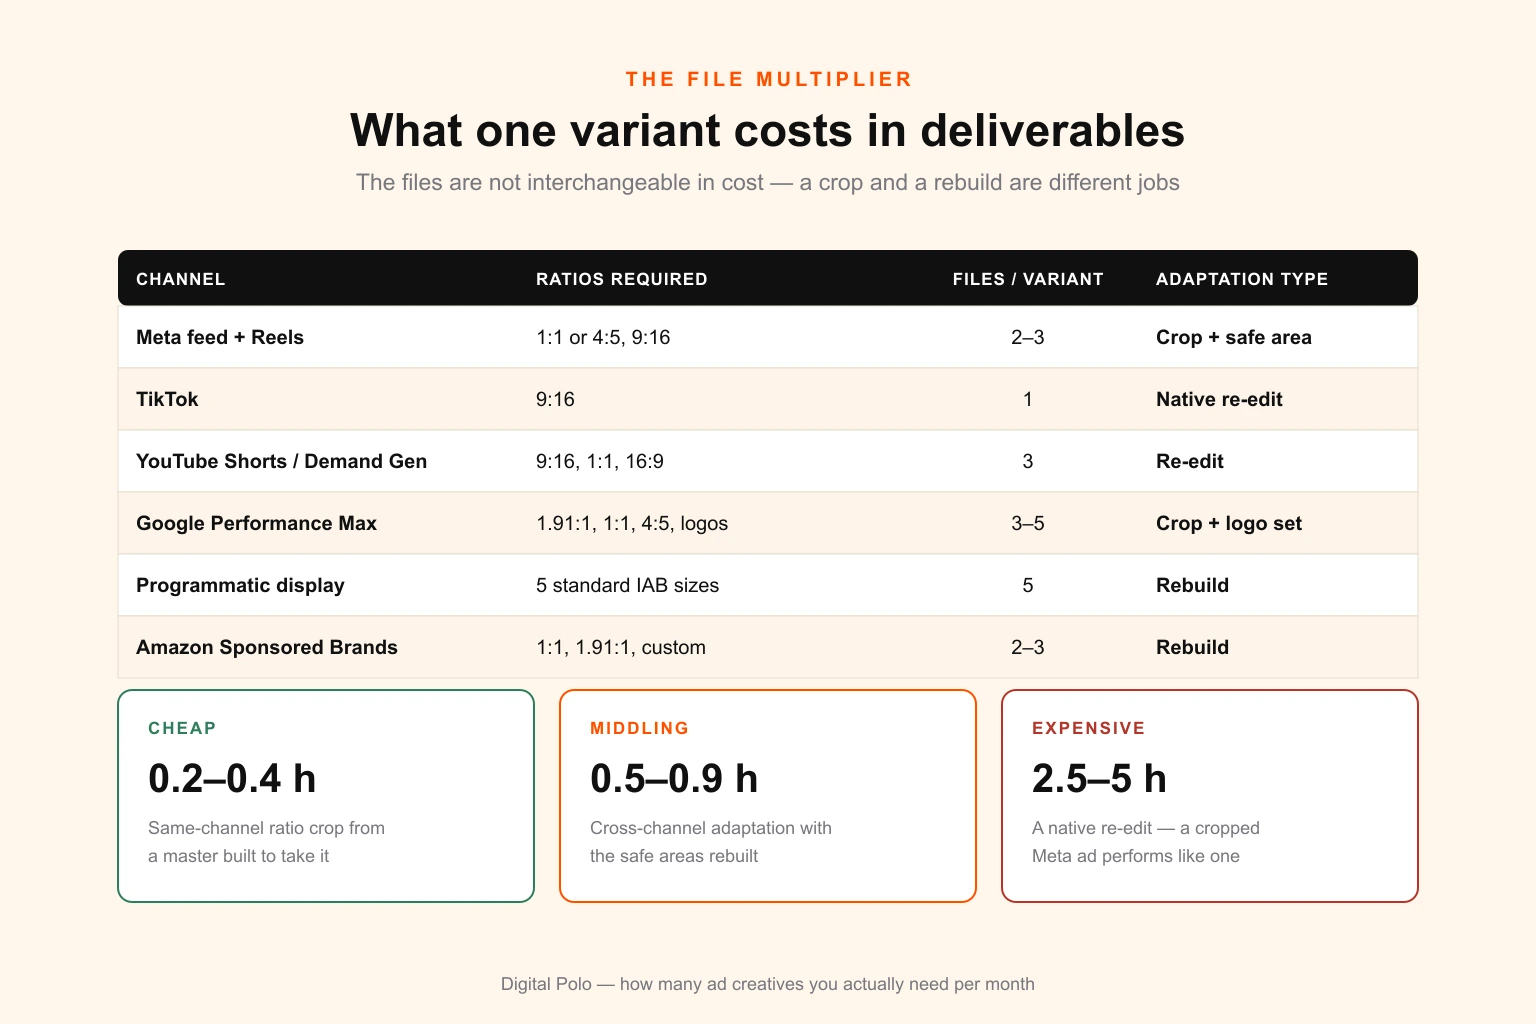
| Channel | Ratios required | Files per variant | Adaptation type |
|---|---|---|---|
| Meta feed + Reels | 1:1 or 4:5, 9:16 | 2–3 | Crop plus safe-area rebuild |
| TikTok | 9:16 | 1 | Native re-edit, not a crop |
| YouTube Shorts / Demand Gen | 9:16, 1:1, 16:9 | 3 | Re-edit |
| Google Performance Max | 1.91:1, 1:1, 4:5 plus logo set | 3–5 | Crop plus logo variants |
| Programmatic display | 5 standard IAB sizes | 5 | Rebuild |
| Amazon Sponsored Brands | 1:1, 1.91:1, custom | 2–3 | Rebuild |
The column that misleads is "files per variant," because it implies the files are interchangeable in cost. They are not.
A Meta 1:1 to 4:5 adaptation is genuinely cheap — 0.2 to 0.4 hours if the master was built with the ratio in mind, which is the entire argument for building masters that way. A TikTok version of a Meta ad is not an adaptation at all; a cropped Meta ad reads as a cropped Meta ad and performs like one, and doing it properly means a native re-edit with different pacing, different text treatment and a different first frame. A display set is five rebuilds, because 160×600 and 728×90 have nothing in common with each other or with anything else you have made.
So the honest version of the multiplier is not "seven files per variant." It is "two cheap files, one expensive one, and three or four somewhere in between." Which is why the correct sequencing question at brief time is not which ratios do we need but which channels genuinely deserve native treatment this month — and the answer is usually fewer than the media plan implies. The social media image specs by platform are worth having open when you make that call.
When to refresh, diagnosed rather than scheduled
Refresh cycles in the planning table are averages. The account will tell you the real answer if you read the right four signals, and the important thing they do is separate creative fatigue from audience fatigue — two failures that look identical on a topline performance chart and have opposite fixes.
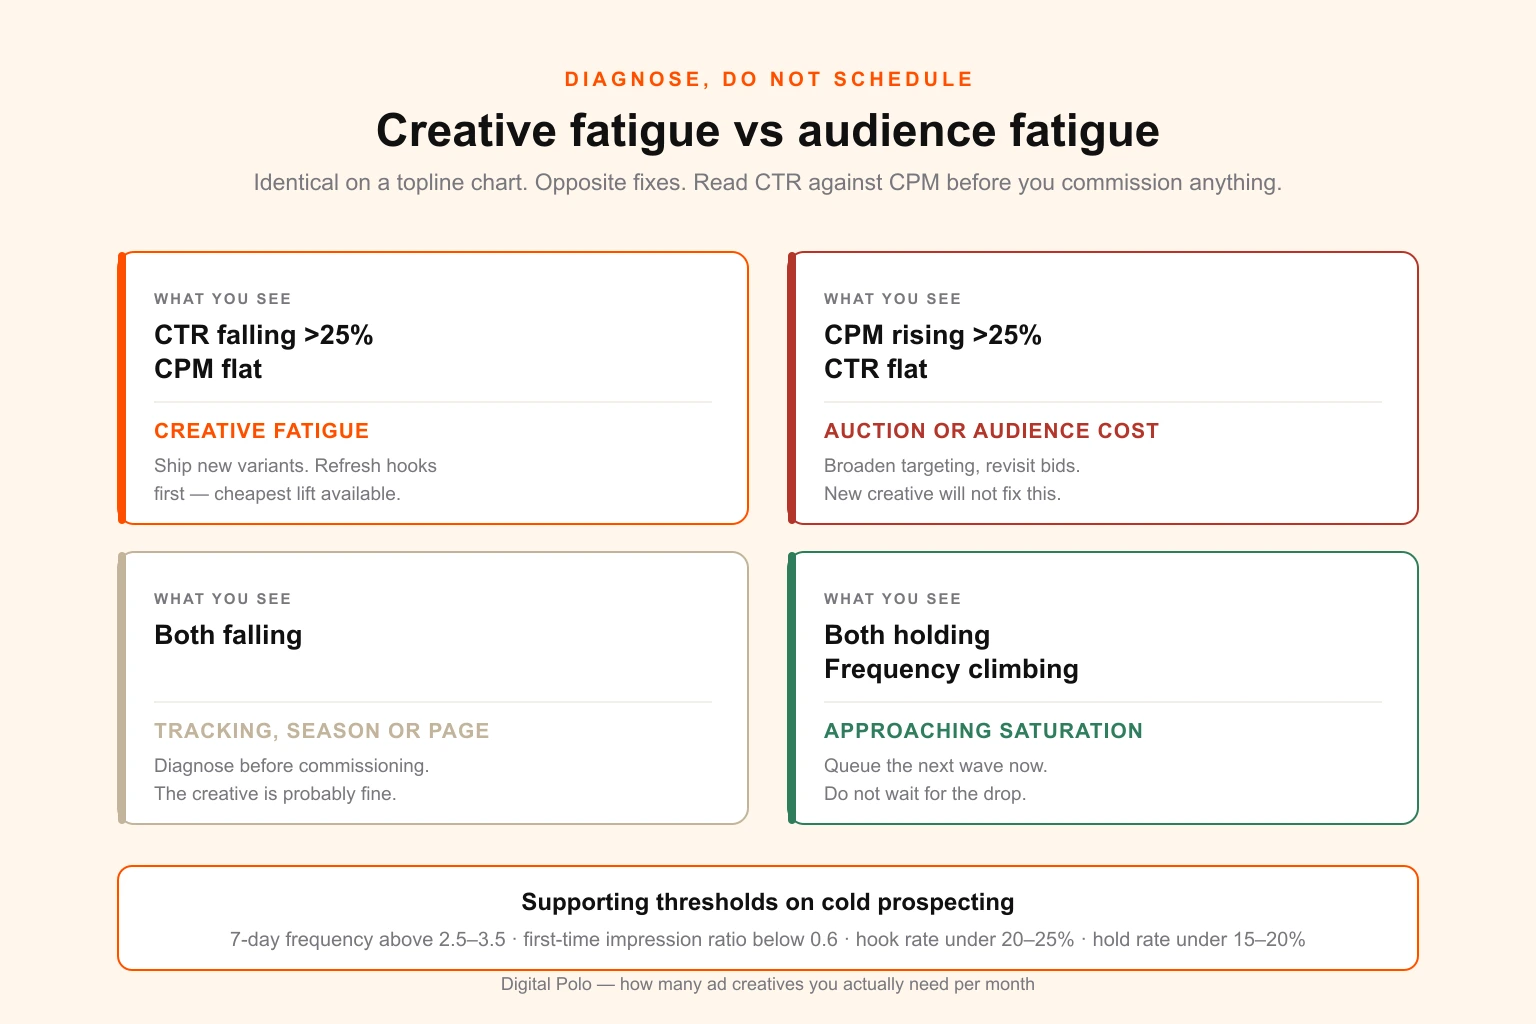
| What you see | What it means | What to do |
|---|---|---|
| CTR falling >25% from week-one baseline, CPM flat | Creative fatigue | Ship new variants; refresh hooks first |
| CPM rising >25%, CTR flat | Audience or auction cost | Broaden targeting, revisit bids — new creative will not fix it |
| Both falling | Tracking, seasonality or landing page | Diagnose before commissioning anything |
| Both holding, frequency climbing | Approaching saturation | Queue the next wave now, do not wait for the drop |
Supporting thresholds worth monitoring on cold prospecting audiences: seven-day frequency above 2.5 to 3.5, first-time impression ratio below roughly 0.6, hook rate on video below 20 to 25 per cent, and hold rate below 15 to 20 per cent. Any two of those firing together is a reliable signal that the library is spent.
The expensive mistake here is producing new creative to solve an auction problem. It is expensive twice: once for the files, and once for the month of scaling you lost while you waited to see whether they worked.
The production reality: hours, capacity and the ceiling
Everything above produces a number of files. This is what those files cost in time, which is the number that decides whether your plan is real.
| Deliverable | Hours |
|---|---|
| Ratio adaptation from a built master, same channel | 0.2–0.4 |
| Cross-channel adaptation with safe-area rebuild | 0.5–0.9 |
| New static from an existing concept and template | 0.75–1.5 |
| New static, new concept, new layout | 2–4 |
| Animated static, 3–6 seconds, from a built static | 1–2 |
| Short-form video edit from supplied footage, 15–30s | 2.5–5 |
| UGC-style edit with captions and three hook variants | 4–7 |
| Concept development: angle, hook set, storyboard | 3–6 per concept |
Now the capacity arithmetic, which is the part that tends to end arguments.
One mid-level designer is contracted for something like 35 hours a week and delivers 25 to 30 genuinely productive hours once briefs, revision rounds, stand-ups, feedback loops and admin are removed. Call it 110 to 130 hours a month, and be suspicious of any plan that assumes more.
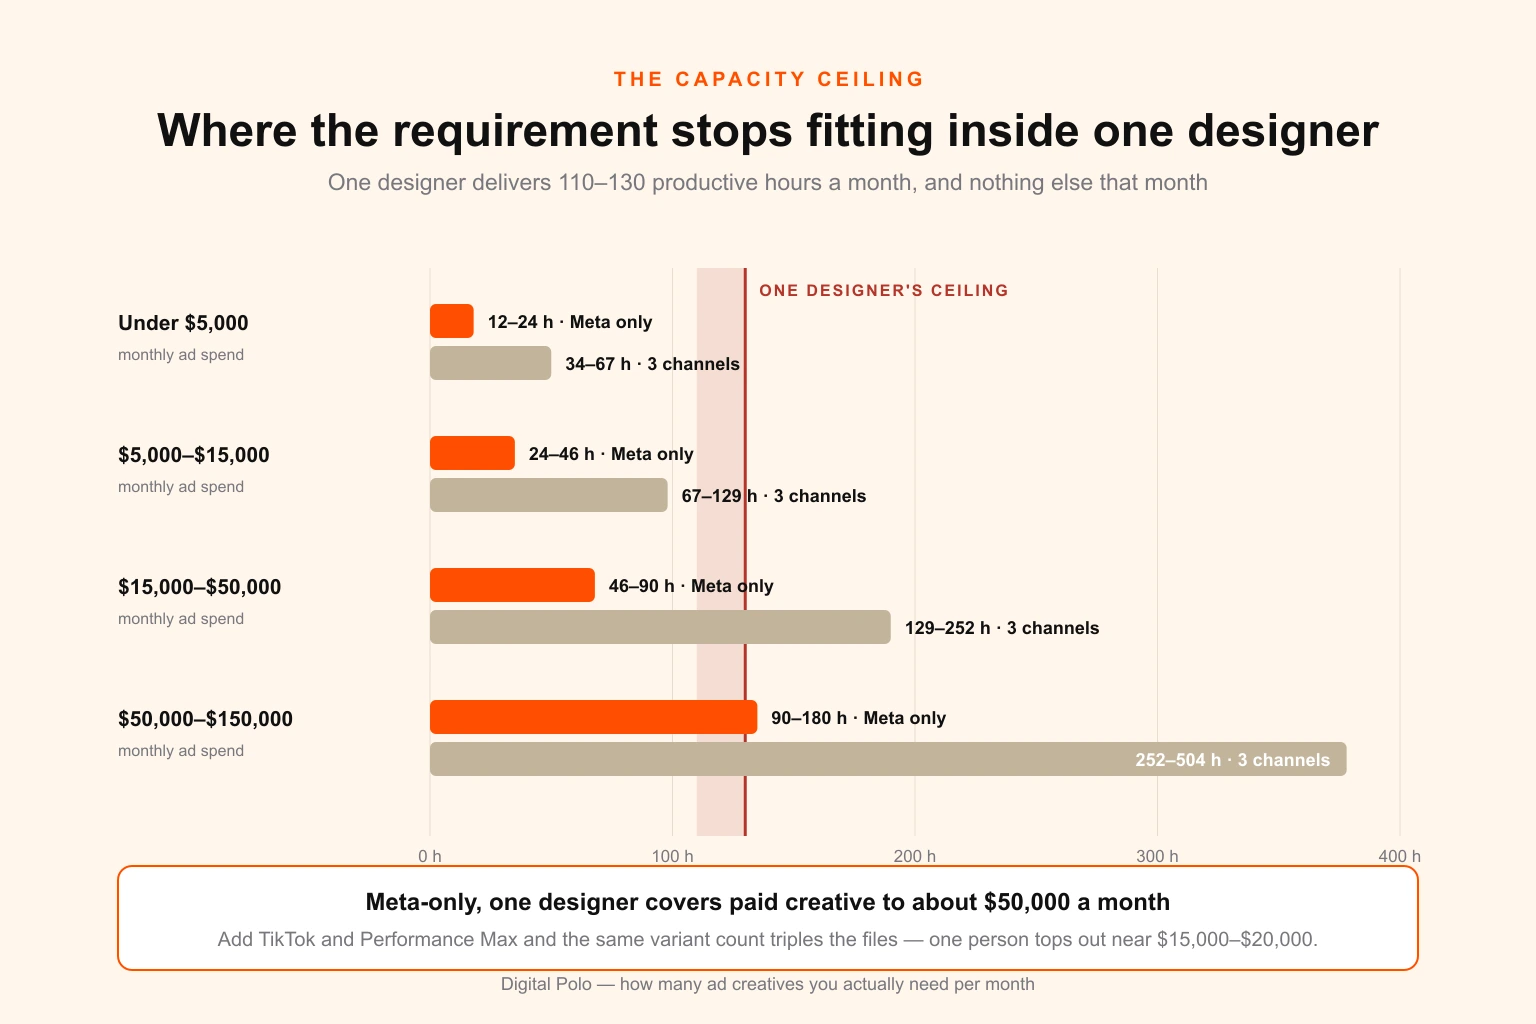
Against that ceiling:
- Meta-only, one designer covers paid creative up to roughly $50,000 a month in ad spend — and covers nothing else. No landing pages, no email, no decks, no packaging, no rebrand support.
- Meta plus TikTok plus Performance Max, the same person tops out somewhere around $15,000 to $20,000 a month in spend, because the file count roughly triples while the hours do not.
That second figure surprises people, and it is the single most useful sentence in this article for anyone about to write a job description. A company spending $30,000 a month across three channels and hiring one designer to cover "creative" has, without realising it, hired someone for a job that is 200 to 250 hours a month.
At market rates the two options price closer than most people expect. A US mid-level in-house designer at $75,000 to $95,000 in salary is $95,000 to $125,000 loaded, which is $7,900 to $10,400 a month. Buying the same 120 hours from a studio or senior freelancer at a blended $65 to $95 an hour is $7,800 to $11,400. The decision is therefore not about rate. It is about three other things: variance, because ad creative demand spikes around launches and quarters and a salaried designer cannot flex; coverage, because one person cannot hold statics, motion, UGC editing and concepting at a professional standard; and continuity, because a single hire is a single point of failure in a function that stops the account when it stops.
The pattern that works above about $30,000 a month is a hybrid: an in-house creative lead who owns concepts, brand judgement and the brief, with variant production and ratio adaptation resourced externally at a fixed monthly cost. The lead is doing the work that moves hit rate — which the arithmetic above shows is worth more than raw output — and the volume is being produced by people whose entire job is volume. Unlimited graphic design vs hiring a full-time designer runs that comparison in full, and the freelancer comparison covers the third option, which fits accounts with a genuinely flat demand curve.
If you are an agency rather than an advertiser, this arithmetic is also your commercial opening. A client spending $50,000 a month has a 90 to 180 hour creative requirement they are currently solving badly, and adding a design retainer to a media-only account is the play that converts that into recurring revenue — with white-label fulfilment sitting behind it so the margin survives. The agency-side overview covers how that arrangement is structured in practice, including NDAs and source-file handling.
What to cut when you cannot produce enough
Most accounts land in a gap between what the models say they need and what they can actually make this month. The gap is normal. What matters is cutting deliberately rather than letting the shortfall land wherever the queue happens to break.
Cut in this order.
First, cut channels, not volume within a channel. Half-covering three platforms is worse than fully covering one. Three creatives on TikTok that were cropped from Meta will underperform and then be misread as evidence that TikTok does not work.
Second, cut ratio coverage on the tail placements. Audience Network, Messenger and the long-tail display sizes rarely justify their file count. Cover the placements that carry your delivery and let the platform crop the rest.
Third, cut variants per concept before you cut concepts. Four concepts at three variants each will teach you more than two concepts at six, because variance between concepts is far larger than variance within one.
Fourth, substitute copy testing for creative testing. Headline and primary-text variants cost nothing to produce and can be read on the same spend. They will not save a bad concept, but they routinely extend a good one by weeks.
Last, and only last, extend winner lifespan deliberately — rotate the hook on a proven body, re-cut the first three seconds, swap the end card. A hook rotation is 0.5 to 1 hour against 2 to 4 for a new build, and on a proven concept it frequently buys most of the lift of a new asset.
What should never be cut is the read floor. Producing twenty under-funded creatives instead of eight properly-funded ones is the one trade that guarantees a wasted month.
Six mistakes that produce the wrong number
Briefing in creatives and budgeting in files. The brief says thirty, the invoice reflects two hundred, and the argument that follows is entirely avoidable by using the three-word vocabulary at the top of this article.
Testing on budgets that cannot read the test. The most common and most expensive error in the whole category. If the kill threshold is not clearing inside the test window, you are not testing.
Loading eight creatives into an ad set doing $100 a day. Delivery consolidates onto one or two regardless, the rest starve, and you have manufactured six files to learn nothing. Three to six per ad set, with enough budget behind each.
Treating refresh as a calendar event. Monthly refreshes retire creatives that were still working and keep creatives that stopped working three weeks ago. Diagnose instead.
Producing new creative to fix a CPM problem. See the diagnostic table. This costs a production cycle and a month of scaling.
Counting variants that are not actually different. Four colourways of one layout is one variant with three expensive typos. If a test cannot change your mind about anything, it is not a test — and this failure is what a bad hit rate usually turns out to be on inspection.
The six numbers to report monthly
Volume on its own is a vanity metric. These six turn it into a system, and they are all derivable from data you already have.
Creative win rate — variants beating control, as a percentage of variants tested. This is the master input. Rising means you can produce less; falling means your concepts have converged.
Readable test rate — the share of tested variants that actually cleared the kill threshold. Anything below 80 per cent means you are over-producing relative to budget, and the fix is fewer tests, not more.
Median winner lifespan — in weeks, trailing three months. It sets your replacement rate and it will shorten as you scale, which is worth seeing before it bites.
Concept-to-variant ratio — variants shipped divided by distinct concepts. Above about six and you are polishing rather than exploring.
Cost per delivered file — total creative cost divided by files shipped. The only figure that tells you whether the production model works, and the one that makes the in-house versus partner decision empirical rather than ideological.
Brief-to-live time — median days from approved brief to first impression. This is the constraint on how fast the whole learning loop can turn, and improving it is usually cheaper than increasing volume.
For broader industry context on production costs, turnaround expectations and where design budgets actually go, the 2026 graphic design statistics roundup collects the sourced figures.
The short version
Run both models before you brief anything.
Calculate what your testing budget can genuinely read: testing budget divided by four times your target CPA. Calculate what your hit rate demands: winner slots divided by winner lifespan, divided by hit rate. Take the lower number — that is your monthly variant count, and it is derived from your account rather than from someone else's table.
Then multiply. Two to three files per variant on Meta, seven to nine across three channels, at a blended 1.2 hours per file. That is your production requirement in hours, and if it exceeds 110 to 130 you have passed what one person can deliver.
Then spend your improvement effort on hit rate and winner lifespan rather than on raw volume, because both of them reduce the requirement instead of feeding it.
The account that beats yours is usually not the one producing more. It is the one that knows which of the two constraints it is actually operating under.
Getting the volume made
Most companies arrive at the right number and then discover the number is the easy part.
Digital Polo runs paid creative production as a fixed monthly cost rather than per-asset, which is the structure that fits this shape of work — unpredictable in composition, predictable in volume, and heaviest in exactly the weeks when per-asset quotes hurt most. Statics, ratio adaptations, animated variants and the full placement set across Meta, TikTok, Google and display, on the same queue as everything else the business needs — including the social media design that runs alongside paid and shares the same masters. Plans are $399 and $899 a month, and how the model actually works covers scope, turnaround and what a queue does and does not absorb.
If you want the arithmetic run against your own account before you commit to a headcount decision, send the spend, the target CPA, the channels and your last quarter's hit rate, and we will tell you what the file count and hours honestly look like. For the wider market context on what individual asset types cost, the graphic design pricing guide breaks it down by deliverable, and the full plan comparison covers the subscription end of the range.
Frequently asked questions
How many ad creatives do I need per month? As a planning figure: 4 to 8 new variants under $5,000 in spend, 8 to 15 between $5,000 and $15,000, 15 to 30 between $15,000 and $50,000, 30 to 60 between $50,000 and $150,000, and 60 to 120 above that. But the band is a sanity check, not the answer. Your real number is the lower of two calculations — how many creatives your testing budget can fund past the kill threshold, and how many tests your hit rate requires to keep winner slots filled. Producing past the lower of those two is waste, not velocity.
How much spend does a single creative need before I can judge it? Three to five times target CPA to kill it, fifteen to twenty-five times to promote it. At a $40 CPA that is $120 to $200 before a zero means anything, and $600 to $1,000 before you should move real budget behind a winner. Below the kill threshold you are sampling noise, and producing forty creatives on a budget that reads twelve is the most common expensive mistake in paid social.
What is the 70:20:10 rule in advertising? Roughly 70 per cent of spend behind proven performers, 20 behind iterations, 10 behind new swings. Useful as a budget split, misleading as a production brief — the three buckets have wildly different creative costs per unit. The 70 needs refreshes and ratio coverage; the 10 needs new concepts, new footage and new layouts, and consumes a disproportionate share of hours relative to its budget share. Plan production against the buckets, not the total.
How many creatives should I run per ad set? Three to six active, and the constraint is arithmetic rather than taste. Delivery consolidates onto one or two ads regardless of how many you load, so each extra creative fragments the budget and slows every read. An ad set doing $100 a day with eight creatives in it accumulates nothing legible on any of them. Fewer per ad set with more spend behind each gives faster, cleaner reads at identical budget.
What is the 3-2-2 method for Facebook ads? Three ad sets, two creatives, two copy variants, run as a structured test so each cell gets enough delivery to be legible. The value is the discipline rather than the specific numbers — it caps variant count and changes one dimension at a time so results can be attributed. Adjust the ratios freely; keep the principle that live cells must divide into daily budget in a way that clears the kill threshold inside the test window.
Is $500 a month enough for Facebook ads? Enough to run ads, not enough to test creative. At $500 with a $30 CPA, a four-times kill threshold means about four readable creatives a month, and only if the entire budget goes to testing and none to scaling. At that level run a small library of two or three strong concepts long, refresh quarterly, and take variation from copy rather than new production — copy is free and design hours are not.
How often should I refresh ad creative? When the diagnostics say so. On cold audiences the triggers are seven-day frequency past 2.5 to 3.5, CTR down more than 25 per cent from its week-one baseline while CPM holds, first-time impression ratio under about 0.6, or video hook rate under 20 to 25 per cent. As a planning proxy the cycle runs 6 to 8 weeks under $5,000 a month and compresses to 1 to 2 weeks above $150,000, because higher spend reaches the same people more often in less time.
What is the difference between a concept, a variant and a file? A concept is an angle. A variant is one execution of it, and it is the unit you test. A file is one variant at one ratio for one placement, and it is the only unit a designer sees. Roughly one concept to four or six variants, and one variant to two or three files on Meta or seven to nine across three channels. Confusing them is why briefs are chronically under-scoped: a request for twenty creatives is usually a request for a hundred and fifty deliverables.
What is a good creative win rate? Between 10 and 25 per cent of tested variants beating control, and most accounts sit near the bottom. It matters more than any spend table because it sets production volume directly — four winner slots, a six-week lifespan and a one-in-eight hit rate means 29 tests a month just to stand still. Track it: a rising win rate lets you cut volume, and a falling one is the earliest signal your concepts have stopped differing from each other.
Can one in-house designer keep up with paid social? Up to about $50,000 a month if you are Meta-only and they do nothing else. One designer delivers 25 to 30 productive hours a week — 110 to 130 a month — and Meta-only creative at $50,000 in spend is around 75 files and 90 to 180 hours. Add TikTok and Performance Max and the same variant count becomes 210 files, which passes one person somewhere around $15,000 to $20,000 in spend. Above that the working pattern is an in-house lead on concepts and quality with adaptation resourced externally.
How many creatives do B2B accounts need compared with DTC? Far fewer, for a reason that is easy to miss. A $400 CPA means one creative needs $1,200 to $2,000 behind it before a null result is meaningful, so a $15,000 monthly budget genuinely reads two or three new creatives a month. Producing fifteen guarantees none of them is legible. Test at concept level rather than variant level, judge on hook rate, hold rate and CTR long before CPA stabilises, and spend the hours on fewer, better assets with longer lifespans.
Should I make more creative or find more audiences when performance drops? Diagnose first, because the two failures look identical on a topline chart and have opposite fixes. CTR falling with CPM flat is creative fatigue and new creative is the answer. CPM climbing with CTR flat is auction cost, and no amount of new creative will touch it. Both falling means check tracking and seasonality before commissioning anything. Producing creative to solve an auction problem costs a production cycle and a month of scaling. The full differential diagnosis — metric signatures, frequency bands and the isolation test that settles it — is in creative fatigue vs audience fatigue.