50 graphic design statistics for 2026. Industry size, designer salaries, design ROI, design subscription growth, branding investment, logo design, AI adoption, web and UX trends, design tools market, and designer demographic data. Every statistic is attributed to a public source so you can verify and cite.
This is a linkable reference — bookmark it, share it, cite it. We update the page when new data lands.
Quick read: Global graphic design industry ≈ USD 45–48B. US graphic-designer median wage ≈ USD 58,910. McKinsey Design Index: design-led companies outperform industry benchmarks 2x. Unlimited design subscription category ≈ USD 200–400M annual revenue. Majority of creative professionals now use AI in their workflow.
Industry size and growth
1. The global graphic design services market was estimated at approximately USD 45–48 billion in 2024, with growth projections of 4–5% CAGR through 2030. (IBISWorld, Grand View Research market reports.)
2. The US graphic design services market alone is estimated at approximately USD 15 billion in annual revenue. (IBISWorld US Industry Reports.)
3. The broader creative economy — including graphic design, advertising, marketing, and adjacent creative services — was estimated at over USD 985 billion globally in UNESCO's Creative Economy Outlook. (UNESCO Creative Economy Outlook.)
4. The US Bureau of Labor Statistics reports approximately 290,000 graphic designer roles in the United States in its latest Occupational Outlook Handbook. (US Bureau of Labor Statistics, Occupational Outlook.)
5. The BLS projects graphic designer roles to decline by 4–5% through 2032, but UX/UI design and digital design roles are projected to grow at well above-average rates. (US BLS Occupational Outlook.)
6. The UK design economy contributes approximately GBP 97 billion in gross value added, with graphic design as one of the largest subcategories. (Design Council UK, Design Economy Report.)
7. Approximately 70% of design services revenue globally is concentrated in North America, Europe, and East Asia. (Grand View Research market segmentation data.)
Designer salaries and career
8. The US median annual wage for graphic designers is approximately USD 58,910, according to the most recent BLS data. (US BLS, Occupational Employment Statistics.)
9. The top 10% of US graphic designers earn over USD 99,000 annually. (US BLS, Occupational Employment Statistics.)
10. UK graphic designer median pay is approximately GBP 32,000–36,000, with senior designers earning substantially more. (UK Office for National Statistics, Annual Survey of Hours and Earnings.)
11. UX designers earn 30–50% more than traditional graphic designers in most markets, with senior UX roles commanding USD 110,000+ in the US. (Glassdoor, Built In salary aggregations.)
12. Creative directors in the US earn a median of USD 100,000+ annually, with top markets paying USD 150,000+. (BLS data, AIGA salary survey.)
13. Approximately 35–40% of US graphic designers are self-employed, the highest self-employment rate of any design specialism. (US BLS, Occupational Outlook Handbook.)
14. AIGA's design census found that gender pay gaps persist in the design industry, with female designers earning approximately 10–15% less than male counterparts at comparable career stages. (AIGA Design Census.)
15. Freelance and contract designers represent a growing share of the design workforce, with platforms like Upwork, Fiverr, and 99designs handling billions of dollars in design-services transactions annually. (Platform annual reports, public filings.)
Design ROI and business impact
16. The McKinsey Design Index found that companies in the top quartile for design outperformed industry-benchmark growth by approximately 2x in both revenue and total shareholder returns over a five-year period. (McKinsey, "The Business Value of Design".)
17. The Design Management Institute's Design Value Index found design-led S&P companies outperformed the S&P 500 by approximately 211% over ten years. (DMI Design Value Index.)
18. 94% of users' first impressions of a website are design-related, according to research compiled by Stanford and other UX research bodies. (Stanford Web Credibility Research; subsequent UX studies.)
19. Companies investing in design experience shorter time-to-market for new products, with McKinsey estimating design-led organisations bring products to market 2x faster than the industry average. (McKinsey, Business Value of Design.)
20. Strong brand identity can support a price premium of 10–25% over generic-brand competitors in many consumer categories. (Interbrand "Best Global Brands" trend analyses.)
21. Colour increases brand recognition by approximately 80%, according to research compiled in University of Loyola Maryland studies cited widely in branding literature. (University of Loyola Maryland research on colour and brand recall.)
22. Investment in branding produces measurable returns on customer retention; studies cited by Bain & Company show that a 5% increase in customer retention can lift profits by 25%+. (Bain & Company customer-retention research.)
Design subscription market
23. The unlimited graphic design subscription category was effectively created by Design Pickle in 2015 and has grown to dozens of established providers by 2026. (Industry-tracking publications, Crunchbase.)
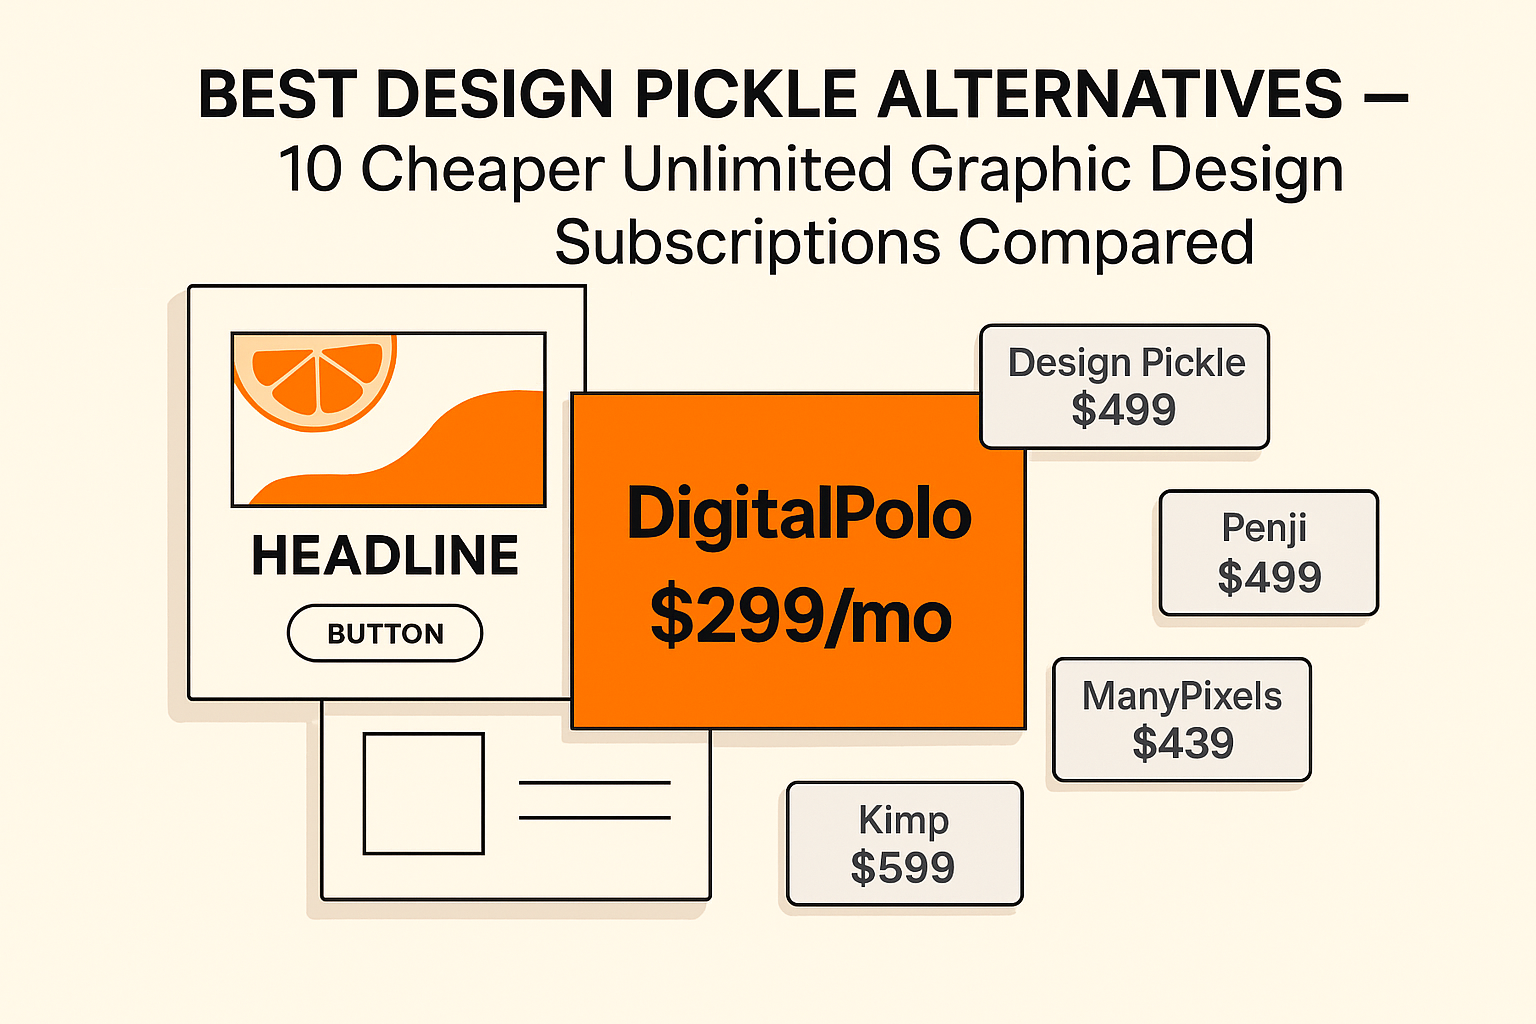
24. Industry estimates place the design subscription category at approximately USD 200–400 million in annual revenue across providers including Design Pickle, DigitalPolo, Penji, ManyPixels, and Kimp. (Industry tracker estimates.)
25. SMB adoption of unlimited design subscriptions has grown each year since 2020, driven by the cost differential vs in-house hiring (a senior in-house designer costs USD 80,000–120,000 fully loaded; a subscription typically costs USD 4,800–12,000 annually). (Industry comparison data; DigitalPolo internal benchmarks.)
26. Average ticket time on unlimited design subscriptions has dropped from approximately 48 hours in 2015 to 24 hours or less at most established providers by 2026. (Provider published service-level data.)
27. Retention rates at leading design subscriptions average 70%+ at 12 months, indicating strong product-market fit in the SMB and marketing-team segment. (Provider published metrics, industry tracker estimates.)
Branding and identity
28. Approximately 70% of consumers say they have higher purchase intent when a brand presents consistently across touchpoints. (Lucidpress / Demand Metric "Brand Consistency" reports.)
29. Brand consistency can lift revenue by 10–20%, according to studies cited by Lucidpress and other brand-management research. (Lucidpress State of Brand Consistency Report.)
30. Colour identification of a brand can take less than 90 seconds of initial exposure to register in viewer memory, according to widely-cited colour psychology research. (University of Loyola Maryland research; Pantone Color Institute.)
31. Rebranding investment at large enterprises typically runs USD 1–10 million for a full identity refresh, depending on scale. (Industry-reported case studies; Interbrand engagement data.)
32. SMB rebranding investment averages USD 5,000–50,000 for the identity layer (logo, colour, typography, basic brand guidelines). (Industry pricing benchmarks; agency rate cards.)
Logo and visual identity
33. The earliest known graphic logos date to the late 19th century, with brands like Bass Brewery (1876) and Coca-Cola (1887) establishing the modern logo as a recognisable brand mark. (Historical brand archives.)
34. Approximately 80% of major global brand redesigns in the last decade have moved toward simpler, flatter, more legible logo forms — a trend industry analysts have called "blanding" when applied carelessly. (Brand New annual review; Under Consideration.)
35. Combination marks (wordmark + symbol locked up) are the most common logo format among growing brands; pure logomarks dominate only at established global brands that have earned symbol-only recognition. (See combination mark guide.)
36. Logo recall improves with consistent application — viewers typically need 5–7 exposures before a logo is reliably recognised, and 20+ exposures before the brand is recognised from the logo alone. (Marketing research summaries; advertising-recall literature.)
Web and UX design
37. Web design quality affects credibility decisions in 50 milliseconds, according to research from Carleton University. (Carleton University research on first-impression timing.)
38. 88% of users are less likely to return to a site after a bad UX experience, according to research cited by Sweor and other UX consultancies. (Sweor UX statistics summary; UX research aggregations.)
39. Mobile devices account for over 60% of global web traffic, making responsive design a baseline requirement for any commercial site. (StatCounter, Statista web-traffic data.)
40. Page load time affects conversion: Google research has consistently shown that pages loading in under 2 seconds convert significantly higher than slower pages, with each additional second of load time reducing conversion rates measurably. (Google Web Vitals research; Akamai conversion studies.)
41. WCAG compliance has become a legal requirement in many markets; the European Accessibility Act enters enforcement in 2025–2026, making accessibility-conscious design a regulatory necessity for many products. (European Accessibility Act regulatory timeline.)
AI in design
42. Adobe's State of Creativity reports show that the majority of creative professionals now use AI tools in their workflow — for ideation, image generation, layout, and editing tasks. (Adobe State of Creativity reports.)
43. McKinsey estimates 30–60% of routine design tasks can be augmented or automated by AI by 2030, with the largest gains in stock-image generation, layout suggestions, and copy variation. (McKinsey Generative AI productivity research.)
44. AI-generated imagery has grown rapidly since the release of Stable Diffusion, Midjourney, and DALL-E in 2022, with billions of images generated by 2026. (Provider published statistics; usage trackers.)
45. Despite AI adoption, demand for senior creative direction, brand strategy, and original concept work has continued to grow — the net effect has been a shift in what designers spend time on, not a contraction of the industry. (McKinsey, Adobe industry analyses.)
46. Most design teams now use AI primarily for first-draft generation and ideation, with human designers handling refinement, brand application, and final output. (Adobe State of Creativity; design-team surveys.)
Design tools market
47. Adobe remains the dominant design-tools provider with Creative Cloud subscription revenue of approximately USD 13–14 billion annually as of the most recent fiscal reports. (Adobe Inc. annual reports.)
48. Figma has grown to over 4 million users since launch, with Adobe's 2022 acquisition agreement valued at USD 20 billion (later terminated by regulators) signalling the strategic importance of collaborative design tools. (Figma published metrics; Adobe acquisition agreement, subsequently terminated.)
49. Canva reports over 150 million monthly active users globally, dominant in the non-professional and SMB design segment. (Canva published metrics.)
50. Open-source design tools including Penpot, Krita, and Inkscape have grown user bases significantly, signalling demand for tools outside the Adobe ecosystem. (Project published download/usage statistics.)
How to use these statistics
These statistics are compiled for use in:
- Design proposals and pitch decks (cite the source — that's why it's listed).
- Articles, blog posts, and reports about the design industry.
- Internal slides justifying design investment to leadership.
- Linkable references in your own content.
If you cite a statistic, link back to this page — it makes it easier for your readers to verify the data and for us to keep the page accurate and updated.
Related reading
- Design as a Service Explained — the unlimited design subscription model.
- Best Unlimited Graphic Design for Small Business — comparison of providers.
- The Evolving Relationship Between Graphic Design and AI — how AI is reshaping design work.
- Brand Guidelines Guide — building a brand identity system.
- Rebranding Guide — when and how to refresh a brand.
Bottom line
The graphic design industry in 2026 is larger, more digital, and more design-led than ever. Companies investing seriously in design outperform peers. The unlimited design subscription category has matured into a real alternative to in-house hiring. AI has reshaped what designers spend time on without contracting demand for senior creative direction.
If you'd like senior-level design as a flat-rate subscription — without the cost or hiring time of an in-house team — DigitalPolo is the unlimited graphic design service built for growing businesses. See the plans →
Last updated May 2026. We update this page when new data lands — bookmark and revisit.