

Performance drops. Cost per acquisition climbs for a third straight week. Somebody in the weekly call says "creative fatigue," everyone nods, and a brief goes out for a fresh batch of creative.
Three or four weeks later the new creative launches. It does roughly what the old creative was doing at the end. The account is now a full production cycle poorer and no better, and the honest conclusion — that the diagnosis was wrong — is rarely the one drawn. What gets drawn instead is that the new creative was not good enough, and a second brief goes out.
The problem is that two entirely different failures produce almost exactly the same chart. In one, your ad has stopped working on people who are still perfectly reachable. In the other, you have run out of reachable people and the ad is fine. They look identical from the topline, they call for opposite responses, and a third possibility — that neither is happening and something else broke — accounts for a larger share of diagnosed fatigue than most teams would like to admit.
This is the differential diagnosis: what each failure actually is, the metric signatures that separate them, the test that settles it in under a week, and what each verdict costs once you know which one you are looking at.
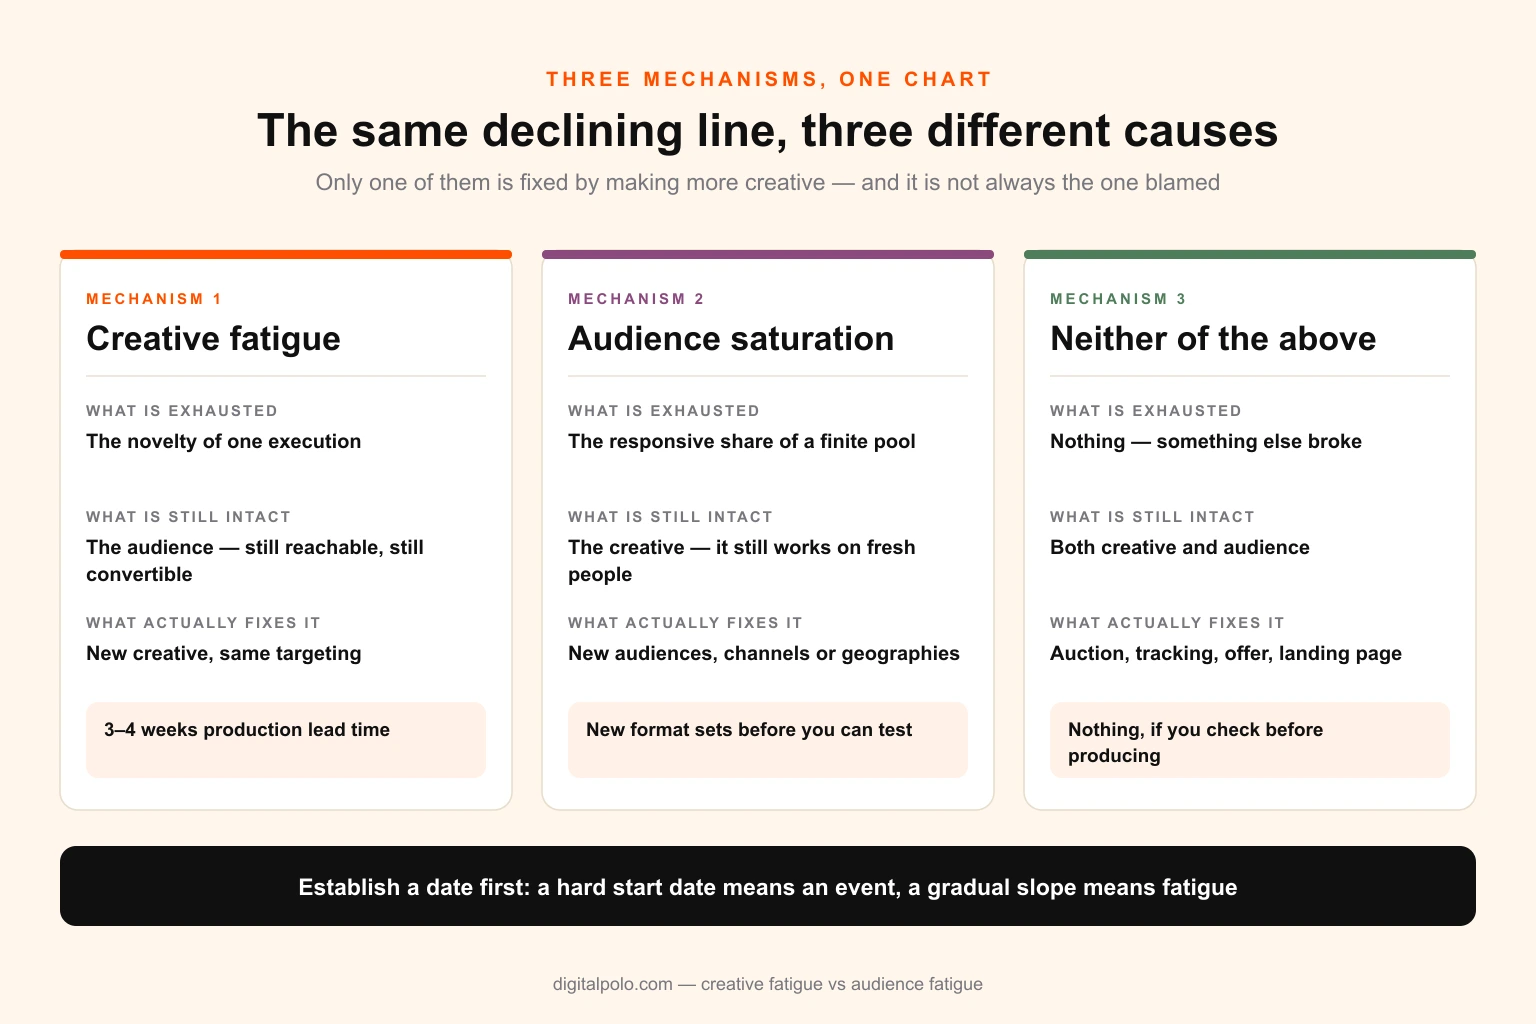
The same downward line on a cost chart is produced by three different mechanisms. Only one of them is fixed by making more creative.
The two failures are not the same mechanism
The vocabulary is loose in this subject, and the looseness is the source of the confusion. It is worth being exact before diagnosing anything.
Creative fatigue is a response problem
Creative fatigue is what happens when a specific execution stops earning attention from an audience that is still perfectly able to give it. The people are there. They are reachable. They have not converted, and they would still convert for something. They have simply seen this particular arrangement of image, hook and claim enough times that it has stopped registering as new information.
The underlying mechanism is habituation, and it operates below deliberation. Nobody decides to ignore your ad on the fifth exposure. Recognition happens faster than evaluation, the eye classifies the unit as already-processed, and the scroll continues. This is why creative fatigue shows up first in the very earliest interaction metrics — the three-second view, the click — rather than in the considered ones. The decision to disengage is made before any decision about your product is available to be made.
The critical property of creative fatigue, and the one that makes it cheap to fix, is that it is specific to the asset, not to the audience. The pool retains its value. A different execution against the same targeting will produce fresh response, because what was exhausted was the novelty of the unit, not the appetite of the people.
Audience saturation is a supply problem
Audience saturation is the opposite shape. The creative is fine. The audience is used up.
Every targetable pool contains a distribution of propensity. A minority will respond readily, a larger group will respond under favourable conditions, and a substantial share was never going to buy this from you at this price at any exposure count. Sustained spend works through that distribution from the top. Early performance is strong because you are converting the ready buyers. As the responsive share is consumed, what remains in the deliverable pool is progressively less inclined, and average performance declines for reasons entirely unrelated to your advertising.
This is not a mistake. It is the arithmetic of a finite audience meeting sustained spend, and it happens to well-run accounts more reliably than to badly run ones, because efficient delivery works through the pool faster.
The critical property here is the mirror image: the exhaustion belongs to the audience, not the asset. The same creative pointed at a fresh pool will perform close to its original numbers. New creative pointed at the exhausted pool will not, and the reason it will not has nothing to do with the quality of the work.
Why the two get confused
Because at the level of a weekly performance summary, they produce the same line. Cost per acquisition rises. Volume falls. Frequency has usually gone up in both cases. Return on ad spend degrades on a similar gradient.
The distinguishing information exists, but it lives in metrics most reporting rolls up and discards — the relationship between click-through rate and impression cost, the share of impressions going to people seeing the ad for the first time, the shape of the reach curve against spend. A dashboard reporting cost per acquisition and return on spend by campaign contains no information capable of separating them, which is why so many diagnoses are made on instinct.
There is also a motivational asymmetry worth naming. Commissioning creative feels like doing something. Concluding that your audience is too small for your spend feels like admitting a strategic problem, and it lands on a different person's desk. Diagnostic errors in this subject are not random — they lean, consistently, towards the creative explanation.
The third possibility: it was never fatigue
Before running any test, rule out the causes that are neither. In a meaningful share of accounts where "creative fatigue" was diagnosed, the decline was produced by something with a date attached to it.
The auction moved
Cost per thousand impressions is set by competition for the same inventory, and it moves for reasons entirely outside your account. Q4 retail, insurance in January, election windows in advertising markets, a large competitor entering your category, a seasonal advertiser returning to the auction. If impression cost has risen 40 per cent while your click-through rate is unchanged, nothing is fatigued. You are paying more for the same attention, and producing new creative will not lower an auction price.
This is the single most common false positive, and it is the easiest to check: put cost per thousand impressions and click-through rate on the same chart before you do anything else.
Tracking broke
A consent banner change, an app update, a pixel firing on a page that got rebuilt, a conversion event renamed during a site migration, an attribution window changed by someone auditing the account. Measured conversions fall. Actual conversions do not. Every subsequent decision is made on a false signal, and the diagnosis of fatigue is the polite version of "we stopped counting properly."
The tell is discontinuity. Fatigue accumulates over weeks; tracking failures drop off a cliff on a specific day. If the decline has a sharp edge, look for a deployment before you look at creative.
The learning phase reset
Any material change — a budget increase past roughly a fifth, a targeting edit, an optimisation event swap, new assets dropped into an existing ad set — can return delivery to an unstable state, and the dip that follows is genuinely indistinguishable from fatigue on a topline chart. Teams that make several edits a week and keep no change log will diagnose fatigue repeatedly and never find the cause, because the cause is in nobody's spreadsheet.
Keeping a dated change log next to performance data is the cheapest diagnostic instrument available in this entire subject, and its absence is remarkably common.
The offer or the landing page changed
Price rose. Free shipping threshold moved. Stock ran out on the hero product. A checkout step was added. The landing page was redesigned by a different team without telling anyone. Ad-level metrics hold up — click-through is stable, cost per click is stable — and everything after the click collapses. That is not an advertising problem at all, and it is diagnosable in one look at the funnel step-through rates.
Seasonality
Your category has a calendar, and the calendar is usually stronger than your creative. Comparing this September to last August tells you almost nothing. Comparing this September to last September tells you a great deal, and a surprising number of accounts have never made that comparison because their reporting window is thirty days wide.
The rule that follows
Establish a date, then establish a mechanism. If the decline has a hard start date, look for an event. If it accumulates gradually over multiple weeks, fatigue of one kind or the other becomes the leading hypothesis, and the rest of this diagnosis applies.
The metric signatures
Each mechanism leaves a different fingerprint across a handful of metrics. Read them together — no single number is diagnostic on its own, and the accounts that get this wrong are usually the ones reading one.
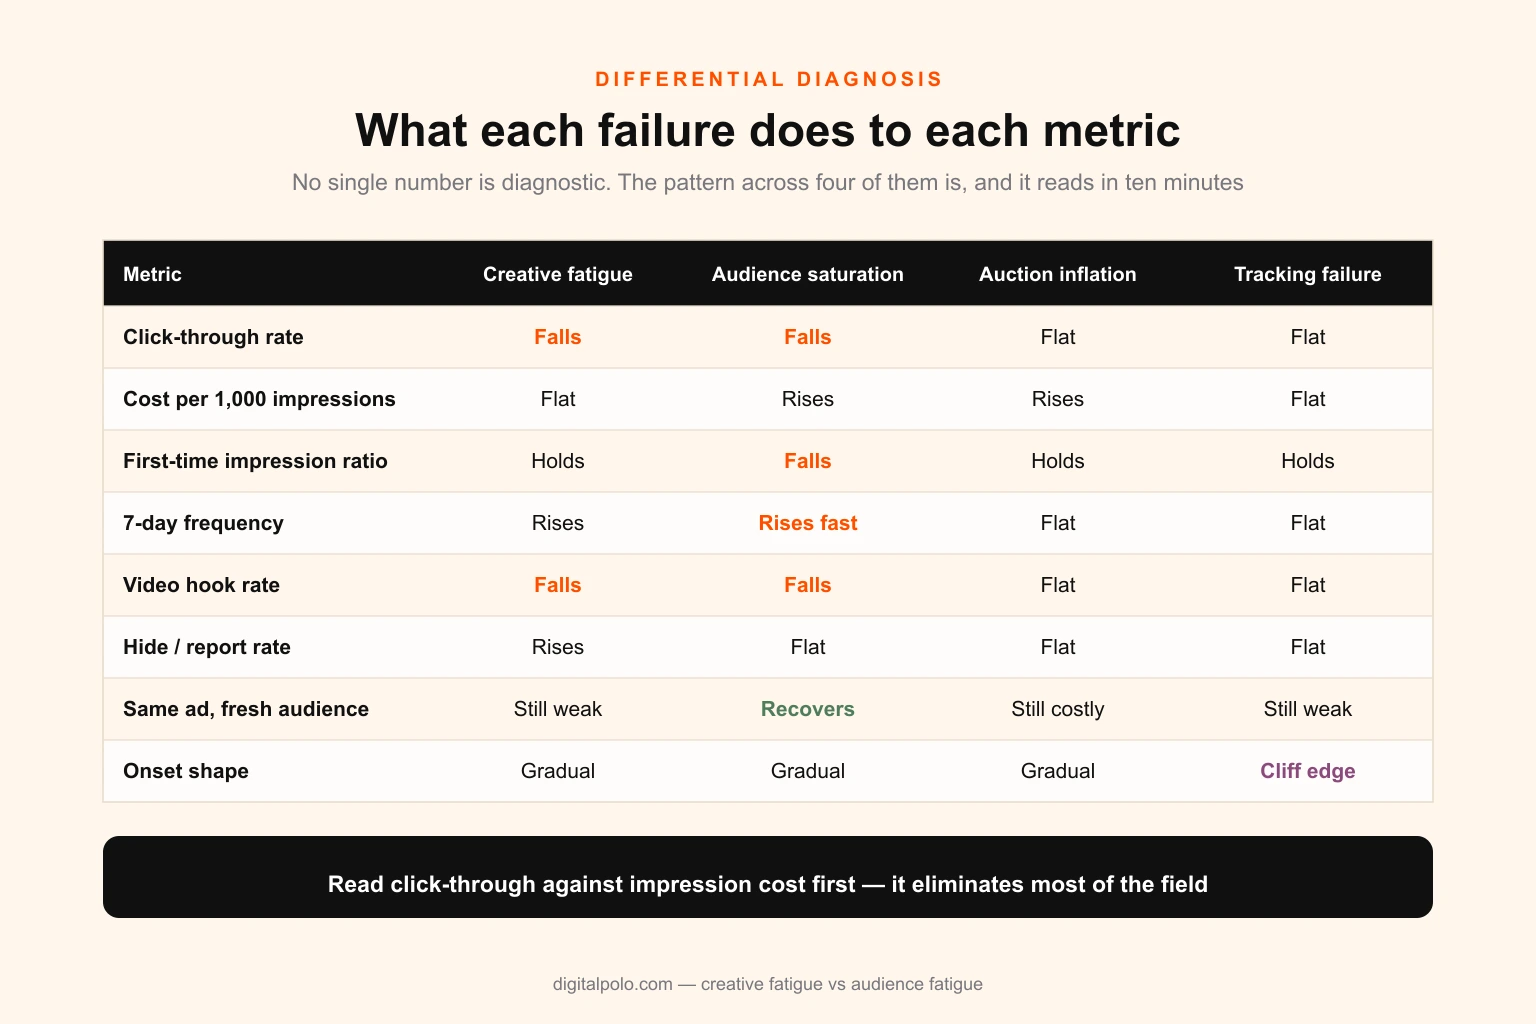
No single metric separates the two. The pattern across four of them does, and it is legible in about ten minutes.
Click-through rate against impression cost
This is the first read and it eliminates most of the field.
Click-through falling, impression cost flat. Delivery costs the same and fewer people are responding. That is a response problem, and it points at creative fatigue.
Impression cost rising, click-through flat. The same share of people are responding and each impression costs more. That is an auction or a supply problem, and it points at saturation or external competition. New creative does not address it.
Both falling together. Check instrumentation and seasonality before doing anything else. Genuine fatigue rarely moves both in the same direction at once.
Both stable while cost per acquisition rises. The problem is after the click. Look at the landing page, the offer, stock availability and the checkout.
First-time impression ratio
The share of your impressions that reach someone seeing the ad for the first time. If your platform exposes it, this is the most directly diagnostic number available, because it measures pool exhaustion rather than inferring it.
Above 0.7 on cold prospecting is healthy. Between 0.5 and 0.7 is a warning band. Sustained readings below 0.5 mean most of your budget is buying repeat exposure to people who have already declined once.
Read against click-through it separates the two failures almost cleanly. A ratio holding steady while click-through falls says you are still reaching new people and they are not responding — creative. A ratio falling alongside click-through says you have stopped reaching new people at all — saturation. On retargeting the metric is meaningless by design, since repeat exposure is the entire mechanism.
Frequency, read properly
Frequency is the most cited and least useful number in this subject, because it is quoted as a threshold when it is a rate of consumption.
Frequency rises for two completely different reasons. Either your spend increased against a stable pool, or your pool shrank against stable spend. Those are opposite situations and the number looks identical. Frequency alone tells you how fast you are consuming attention. It does not tell you whether the attention was worth consuming, and there is no universal figure at which harm begins.
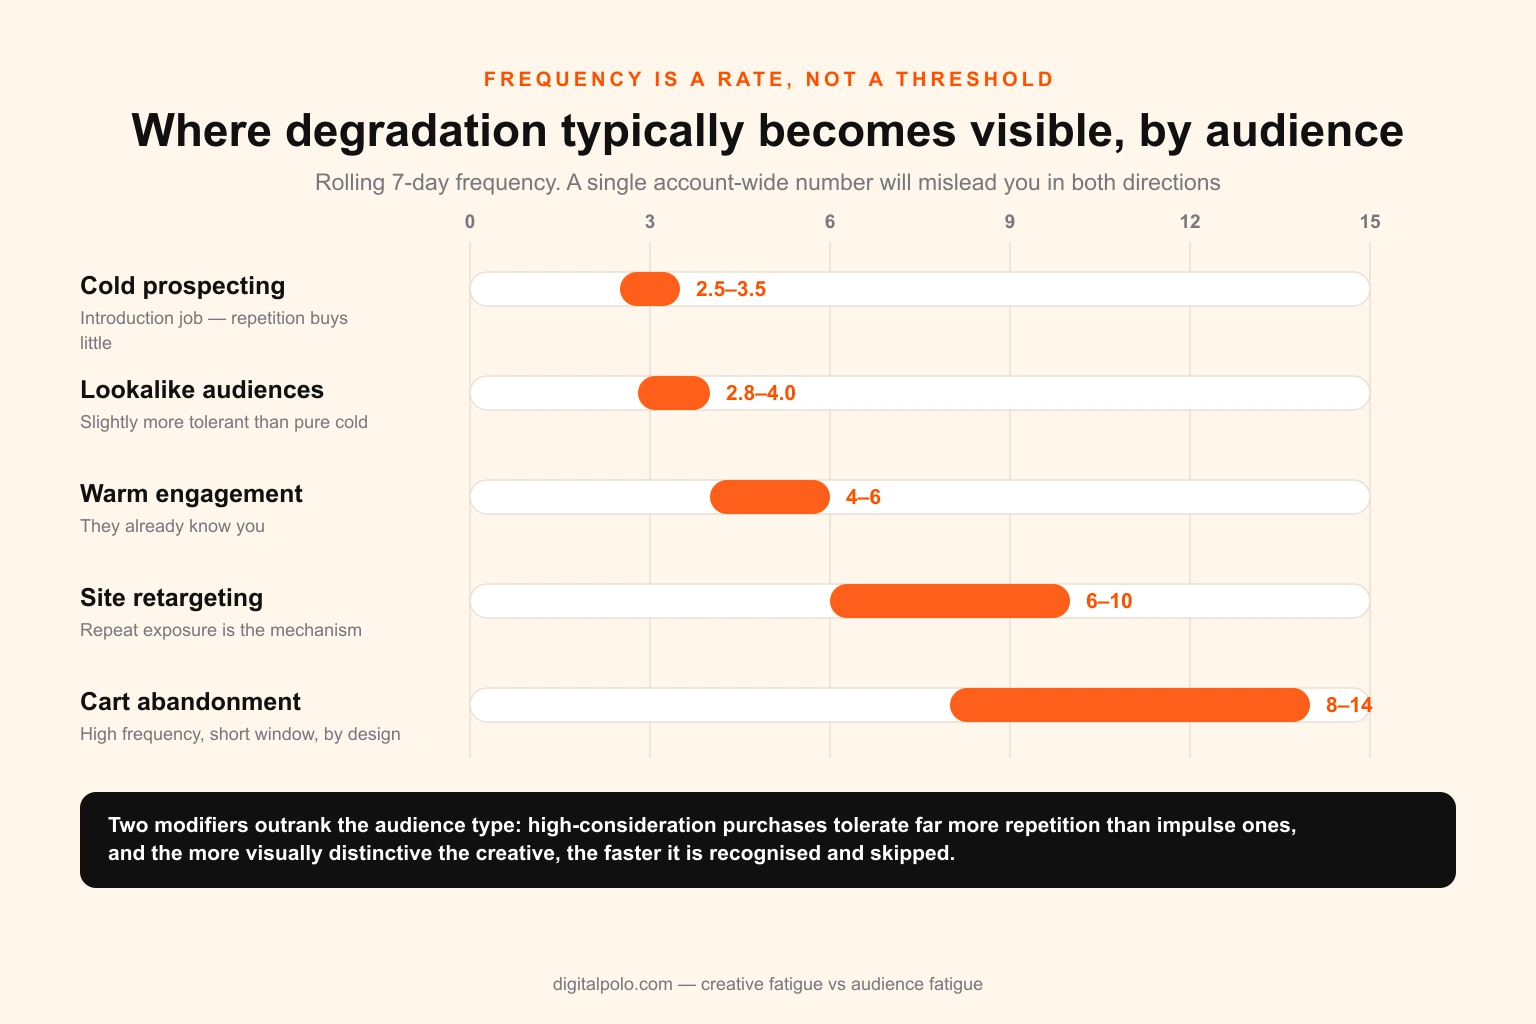
Frequency is only interpretable against audience type and purchase consideration. A single account-wide threshold will mislead you in both directions.
As working bands rather than rules: cold prospecting tends to show degradation between 2.5 and 3.5 over a rolling seven days. Lookalikes behave similarly, a little more tolerant. Warm engagement audiences run comfortably to 4 or 6. Site retargeting frequently sustains 6 to 10 without harm. Cart abandonment sequences run higher still and should, within a short window.
Two modifiers matter more than the audience type. High-consideration purchases tolerate substantially more repetition than impulse ones, because repeated exposure is doing legitimate work in a longer decision. And the more visually distinctive the creative, the faster it fatigues — a striking asset is recognised, and therefore skipped, sooner than a plain one.
Hook rate and hold rate on video
For video, three-second views over impressions gives you the cleanest early-warning signal in paid social. It measures the moment of recognition directly, before any evaluation of your offer takes place.
Hook rate degrading while hold rate — the share of hook-rate viewers who reach a meaningful completion point — stays stable is the precise signature of creative fatigue at the opening frame. The content still works on people who start watching; fewer people are starting. That specific pattern has a cheap fix: re-cut the opening two seconds rather than reshooting the asset.
Both falling together is a content problem rather than a fatigue problem, and it usually means the asset was never as strong as its early numbers suggested.
Negative feedback
Hide rates, "don't show me this" actions and report rates rise under genuine over-exposure and are largely flat under saturation. They are lagging and low-volume, so they confirm rather than detect, but when they move they move for a reason.
The isolation test that settles it
Signatures narrow the field. If you want certainty — and before a five-figure production commitment you should — there is a direct test, and it takes four to seven days.
The logic is straightforward: you have two variables, so change one at a time.
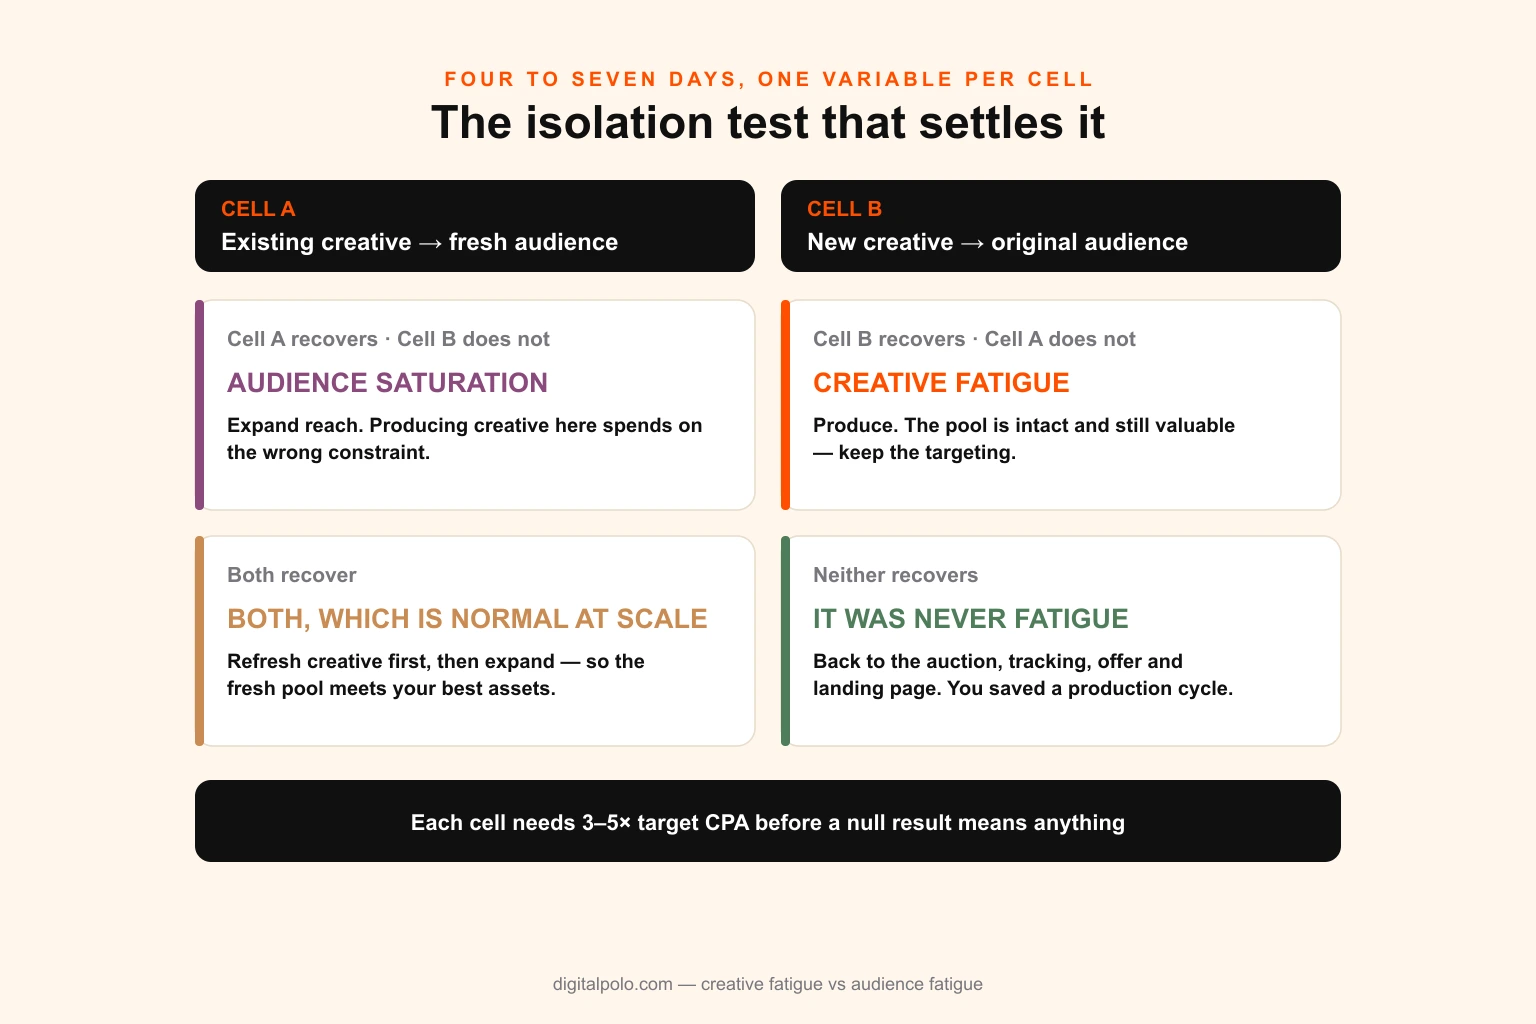
Two cells, one variable each, four possible verdicts. The test costs a few days of budget and routinely saves a production cycle.
Cell A: old creative, fresh audience
Take the declining creative — unchanged, not refreshed, not tweaked — and point it at a genuinely fresh pool. A new lookalike from a different seed, an untouched interest cluster, a different geography, a new channel. The requirement is minimal overlap with the exhausted audience; a 1 per cent lookalike from the same seed is not a fresh pool.
If performance recovers to something near the creative's original numbers, the creative was never the problem. Your audience was.
Cell B: new creative, original audience
Take genuinely different creative — different concept, different hook, different visual system, not a colour variant — and run it against the original targeting.
If performance recovers there, the audience was never the problem. Your creative was.
Reading the four outcomes
A recovers, B does not. Audience saturation. Invest in targeting expansion, new channels, new geographies or new pools. Producing creative here is money spent on the wrong constraint.
B recovers, A does not. Creative fatigue. Your pool is intact and valuable. Invest in production, and keep the targeting exactly as it is.
Both recover. You had both, which is normal at any meaningful scale, and the sequencing matters: refresh creative first because it is faster to deploy, then expand audiences with the new creative already in place so the fresh pool meets your best assets rather than your tired ones.
Neither recovers. It was never fatigue. Go back to the auction, the tracking, the offer and the landing page, and be glad you spent a week finding out rather than a quarter.
Running it honestly
Three things break this test in practice.
Give each cell enough budget to be legible. The floor is three to five times your target cost per acquisition per cell before a null result means anything — below that you are reading noise and will act on it confidently, which is worse than not testing at all.
Do not change two things at once. A "fresh audience" cell that also uses lightly refreshed creative is not a test of anything, and this contamination is extremely common because it feels wasteful to run an asset you have already concluded is dead.
Make cell B genuinely new. This is the failure that quietly invalidates most attempts. If your "new creative" is the same concept with a different background colour, it will fatigue exactly as fast as the original because the audience never perceived it as a different thing. Which raises the question of what new actually means.
What "new creative" actually means
Teams routinely produce twenty new files, see no recovery, and conclude that creative was not the issue. Frequently the issue was that they produced twenty copies of the thing that had already fatigued.
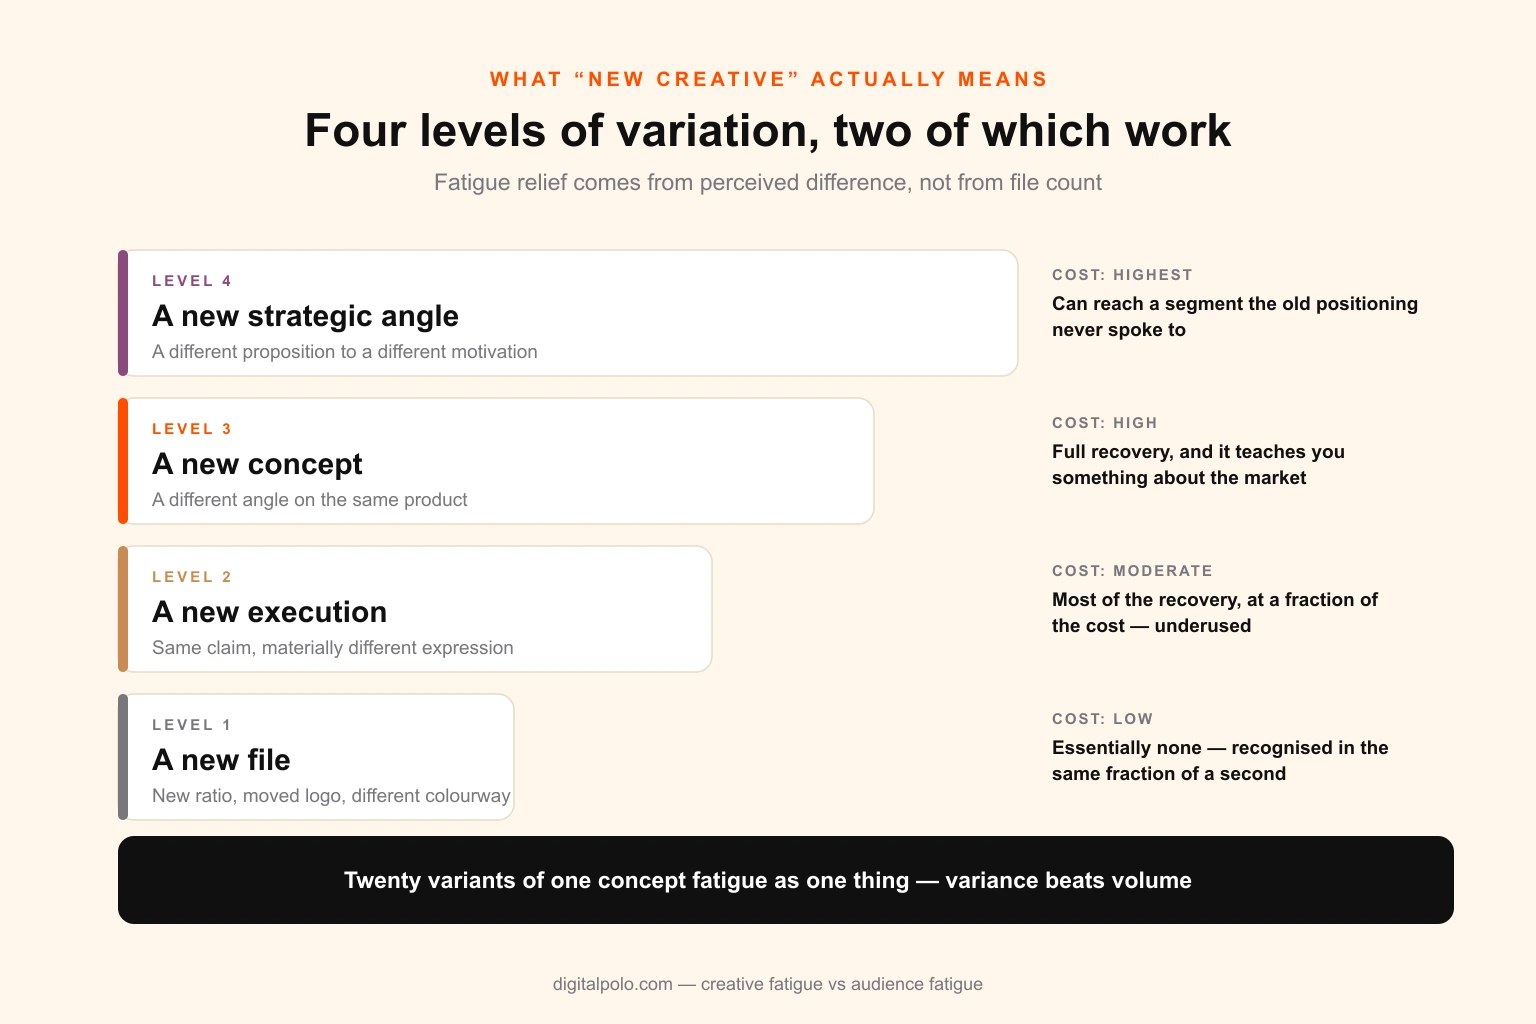
Fatigue relief comes from perceived difference, not file count. Three of these four levels are cheap and only two of them work.
Level one: a new file
The same creative at a different ratio, or with the logo moved, or in a different colourway. This is production work, and necessary work — every concept needs its full set of channel formats — but it delivers essentially no fatigue relief. The audience recognises it in the same fraction of a second.
Level two: a new execution
Same concept and same proposition, materially different expression. New photography, a different model, a restructured layout, a new opening frame, a rewritten hook against the same claim.
This is where most of the value sits, and it is consistently underused because it is unglamorous. It costs a fraction of a new concept, it preserves everything you have learned about what works, and against genuine creative fatigue it usually delivers most of the recovery. A concept that produced your best cost per acquisition for two months has not been disproven — it has been over-shown, and re-expressing it is the highest-return move available.
Level three: a new concept
A different angle on the same product. Problem-led instead of product-led, social proof instead of feature demonstration, price-led instead of quality-led, a different use case, a different customer in frame.
This is what people usually mean by "new creative" and what they usually do not actually produce. It is the level at which a genuinely fatigued account recovers properly, and it is also the level at which you learn something, because a concept test returns information about your market and an execution test only returns information about your art direction.
Level four: a new strategic angle
A different proposition to a different motivation. Not a new way of saying the same thing, but a different thing to say.
This is the one lever that can, occasionally, solve what looks like audience saturation. If the pool is exhausted of people who respond to your current positioning but still contains people who never engaged with it, a genuinely different proposition reaches a different segment inside the same targeting. That is strategy arriving in the form of creative, and it is the reason the two diagnoses sometimes converge. If the pool is saturated in the harder sense — the addressable segment is simply small relative to your spend — no angle solves it.
The practical rule
Variance beats volume. Three properly distinct concepts with two or three executions each will outperform thirty near-identical files at the same budget, because the audience perceives three new things rather than one. A batch of files that share a concept, a hook and a visual system fatigues as a single unit no matter how many of them there are, which is why volume targets produce disappointing results so reliably. The arithmetic for how many you actually need — from testing budget and historical win rate rather than from a target — is worked through in the guide to how many ad creatives you need per month.
What each verdict costs
The two diagnoses have very different price tags, and knowing them in advance is what makes the diagnostic work worth doing.
If it is creative fatigue
You need production, and the constraint is almost always lead time rather than money.
Concepting a batch takes three to five working days. Production — shoot, design, edit — takes five to fifteen depending on whether footage exists. Adaptation across every ratio and placement adds two to four. Review, trafficking and quality assurance add another two to three. That is three to four weeks from brief to live, and the number is stubborn.
Which produces the structural problem at the centre of this whole subject: fatigue is detected in a week and answered in a month. Every team that begins producing at the moment of diagnosis has already accepted three weeks of declining efficiency, and will accept them again on the next cycle, because the pipeline starts when the alarm goes off rather than before it.
The recurring failure is not creative quality. It is that production capacity is sized against average demand while fatigue arrives in spikes, and the spikes land during the periods of highest spend — which is precisely when the gap costs most.
If it is audience saturation
You need reach, and the honest options are fewer than the creative ones.
New lookalike seeds from different source events. Broader targeting with the creative doing the qualifying work. New geographies. New channels, which usually means a new format set to produce before you can even test them. Or accepting a higher cost per acquisition as the price of the volume, which is sometimes exactly the right commercial answer and is almost never proposed out loud.
There is a production consequence here too, and it gets missed. Expanding to a new channel is not a media decision that happens to need assets; it is a media decision that cannot execute without a full asset set built to different specifications. Teams that decide to add a channel and then discover a three-week production dependency have effectively delayed their own fix by a month.
If it was neither
You need a fix to the actual problem, and you have saved yourself a production cycle by finding out. This is the outcome that most justifies the four days the test costs.
Building a pipeline that stays ahead of the curve
Once you have diagnosed the same problem three or four times, the interesting question stops being which failure it was and becomes why you are always answering it late.
Move production ahead of detection
The gap between a one-week detection cycle and a four-week production cycle is structural, and there is only one way to close it: start the next batch before the current one peaks, not after it declines.
In practice that means production runs continuously against a forecast rather than reactively against an alarm. You know roughly how long a creative lasts at your spend level and pool size. Work backwards from that, and the brief for the next batch goes out while the current batch is still winning.
Keep a reserve
Not every tested concept should launch immediately. Holding two or three proven-but-unlaunched concepts in reserve converts a four-week emergency into a same-day swap, and the cost of holding them is nothing beyond the production you were doing anyway.
Accounts that launch everything the moment it is finished have no slack, and no slack means every fatigue event becomes a scramble.
Build format coverage into the first pass
A large share of emergency production is not new creative at all — it is a placement that was never built, discovered at the moment it was needed. Building the full format set at the time of the original production, when the concept and the files are already open, costs a fraction of what it costs to reopen it six weeks later. The same logic applies to asset inventories in every other part of a business: the expensive version of any asset is the one commissioned individually under time pressure.
Instrument the account so detection happens weekly
Most accounts detect fatigue late because nobody is looking at the metrics that move first. A weekly view of click-through rate against its own week-one baseline, cost per thousand impressions, first-time impression ratio, seven-day frequency, and hook rate on video will catch degradation two to three weeks before cost per acquisition makes it obvious. That head start is worth more than any single creative improvement, because it converts a reactive cycle into a planned one.
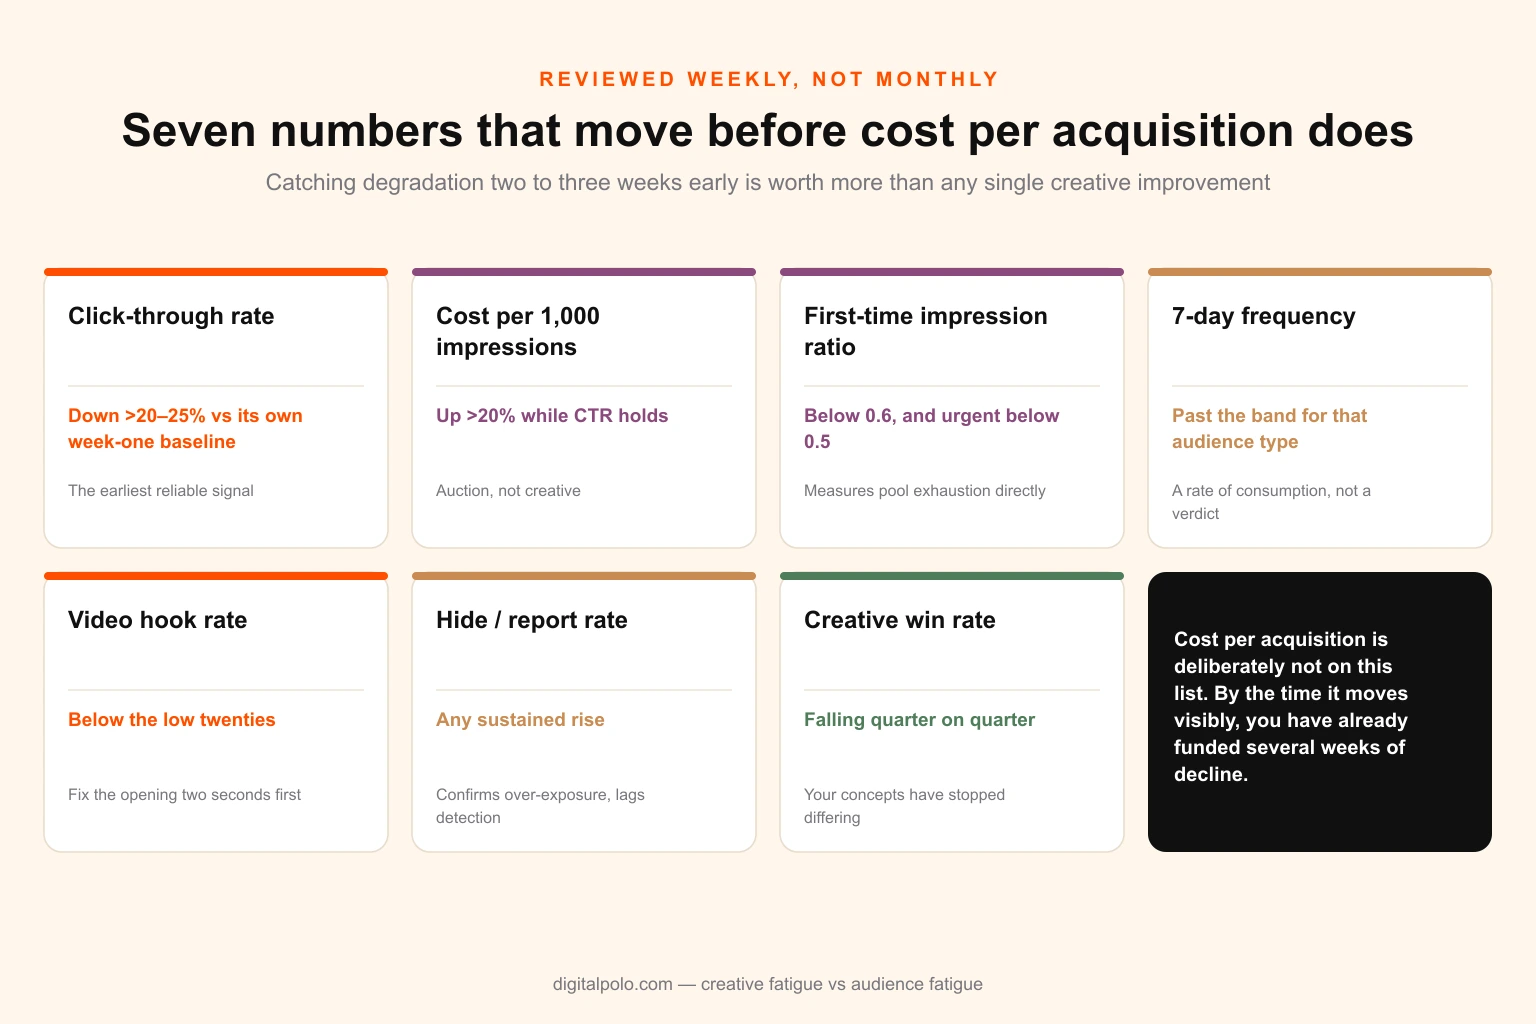
Seven numbers, reviewed weekly. Cost per acquisition is deliberately not the trigger — by the time it moves, you have already paid for the delay.
Resource capacity for the spikes, not the average
This is the part that decides whether any of the above is possible. Creative demand in a paid account is not smooth: it is flat for weeks and then needs three concepts and forty files inside a fortnight. Staffing for the average guarantees a shortfall exactly when the shortfall is most expensive, and staffing for the peak means paying for idle capacity most of the time.
It is the same capacity problem that shows up whenever agencies add creative production to media-only accounts, and it is the reason so many performance teams end up separating concept work — which benefits from being close to the account — from adaptation and volume work, which does not.
Six diagnostic mistakes that cost real money
Treating frequency as a threshold. It is a consumption rate, not a verdict. Accounts at 2.0 with collapsing click-through have a creative problem; accounts at 5.0 with stable efficiency have nothing wrong at all. Acting on the number alone produces both premature refreshes and missed ones.
Waiting for cost per acquisition to confirm it. It is the last metric to move and the most expensive one to wait for. By the time it degrades visibly you have funded several weeks of declining efficiency that the upper-funnel metrics would have flagged.
Refreshing on a calendar. Fixed six-week cycles mistime in both directions — they kill winners that had months left and hold losers that were finished in ten days. Fatigue is driven by spend against pool size, which no calendar knows about.
Producing volume without variance. Twenty variants of one concept fatigue as one thing. This is the most common reason a genuine creative-fatigue diagnosis appears to be disproven by a refresh that did not work.
Changing two variables at once. New creative launched simultaneously with new audiences tells you nothing about either, and guarantees you will face the same ambiguity next quarter with no more information than you have now.
Skipping the change log. A meaningful share of diagnosed fatigue is a budget edit, a targeting change or a tracking break with a date on it. Keeping a dated record of account changes next to performance data is free and resolves more cases than any analysis.
The short version
Two failures, one chart. Creative fatigue means the people are still there and the ad has stopped working on them; audience saturation means the ad is fine and the people are used up. A third category — auction movement, tracking failure, learning resets, offer and landing page changes, seasonality — accounts for more diagnosed fatigue than anyone likes to admit, and all of it has a date attached.
Read click-through rate against impression cost first, because it eliminates most of the field in ten minutes. Add first-time impression ratio, seven-day frequency read against the audience type, and hook rate on video. Then, before any significant production commitment, run the two-cell isolation test: old creative to a fresh audience, new creative to the old audience. Four to seven days, one variable per cell, enough budget in each to be legible.
If it is creative, produce — but produce genuine variation rather than file count, and start the next batch before the current one peaks, because a one-week detection cycle answered by a four-week production cycle guarantees a gap at the worst possible moment. If it is audience, expand reach and accept that new creative will not fix a supply problem. If it is neither, fix the actual thing and count the production cycle you did not waste.
Getting the creative made
Diagnosis is the cheap half. The expensive half is having enough genuinely different creative ready before the decline rather than a month after it — and that is a capacity problem, not a talent one.
Digital Polo produces paid creative as a fixed monthly cost rather than per asset, which suits work that is unpredictable in composition and spiky in timing: new concepts when the diagnosis calls for them, execution refreshes when the concept is still sound, and the full ratio and placement set across Meta, TikTok, Google and display. The social media design that runs alongside paid sits on the same queue and shares the same masters, so a concept that works in feed does not need re-originating for organic.
Plans are $399 and $899 a month, and how the model works covers scope, turnaround and what a queue does and does not absorb. If you want a view of what your own account's refresh cycle implies for production volume, send your spend, channels and typical creative lifespan. For context on what individual assets cost elsewhere, the pricing guide breaks it down by deliverable, and the full plan comparison covers the subscription end. Agencies running this for clients rather than in-house will find the white-label route and the marketing agency partnership more relevant, and the comparison against freelance capacity covers why spiky demand is the case freelancers handle worst.
Related reading: how many ad creatives you need per month for the volume arithmetic, one campaign asset into fifteen formats for the adaptation production, adding a design retainer to media-buying clients for the agency economics, ecommerce creative and SaaS creative for category-specific patterns, and the brand guidelines guide for keeping high-variance creative recognisably yours.